Geomorphometry 2011 - Announcement

Published: Dec 10, 2010 by ISG Board

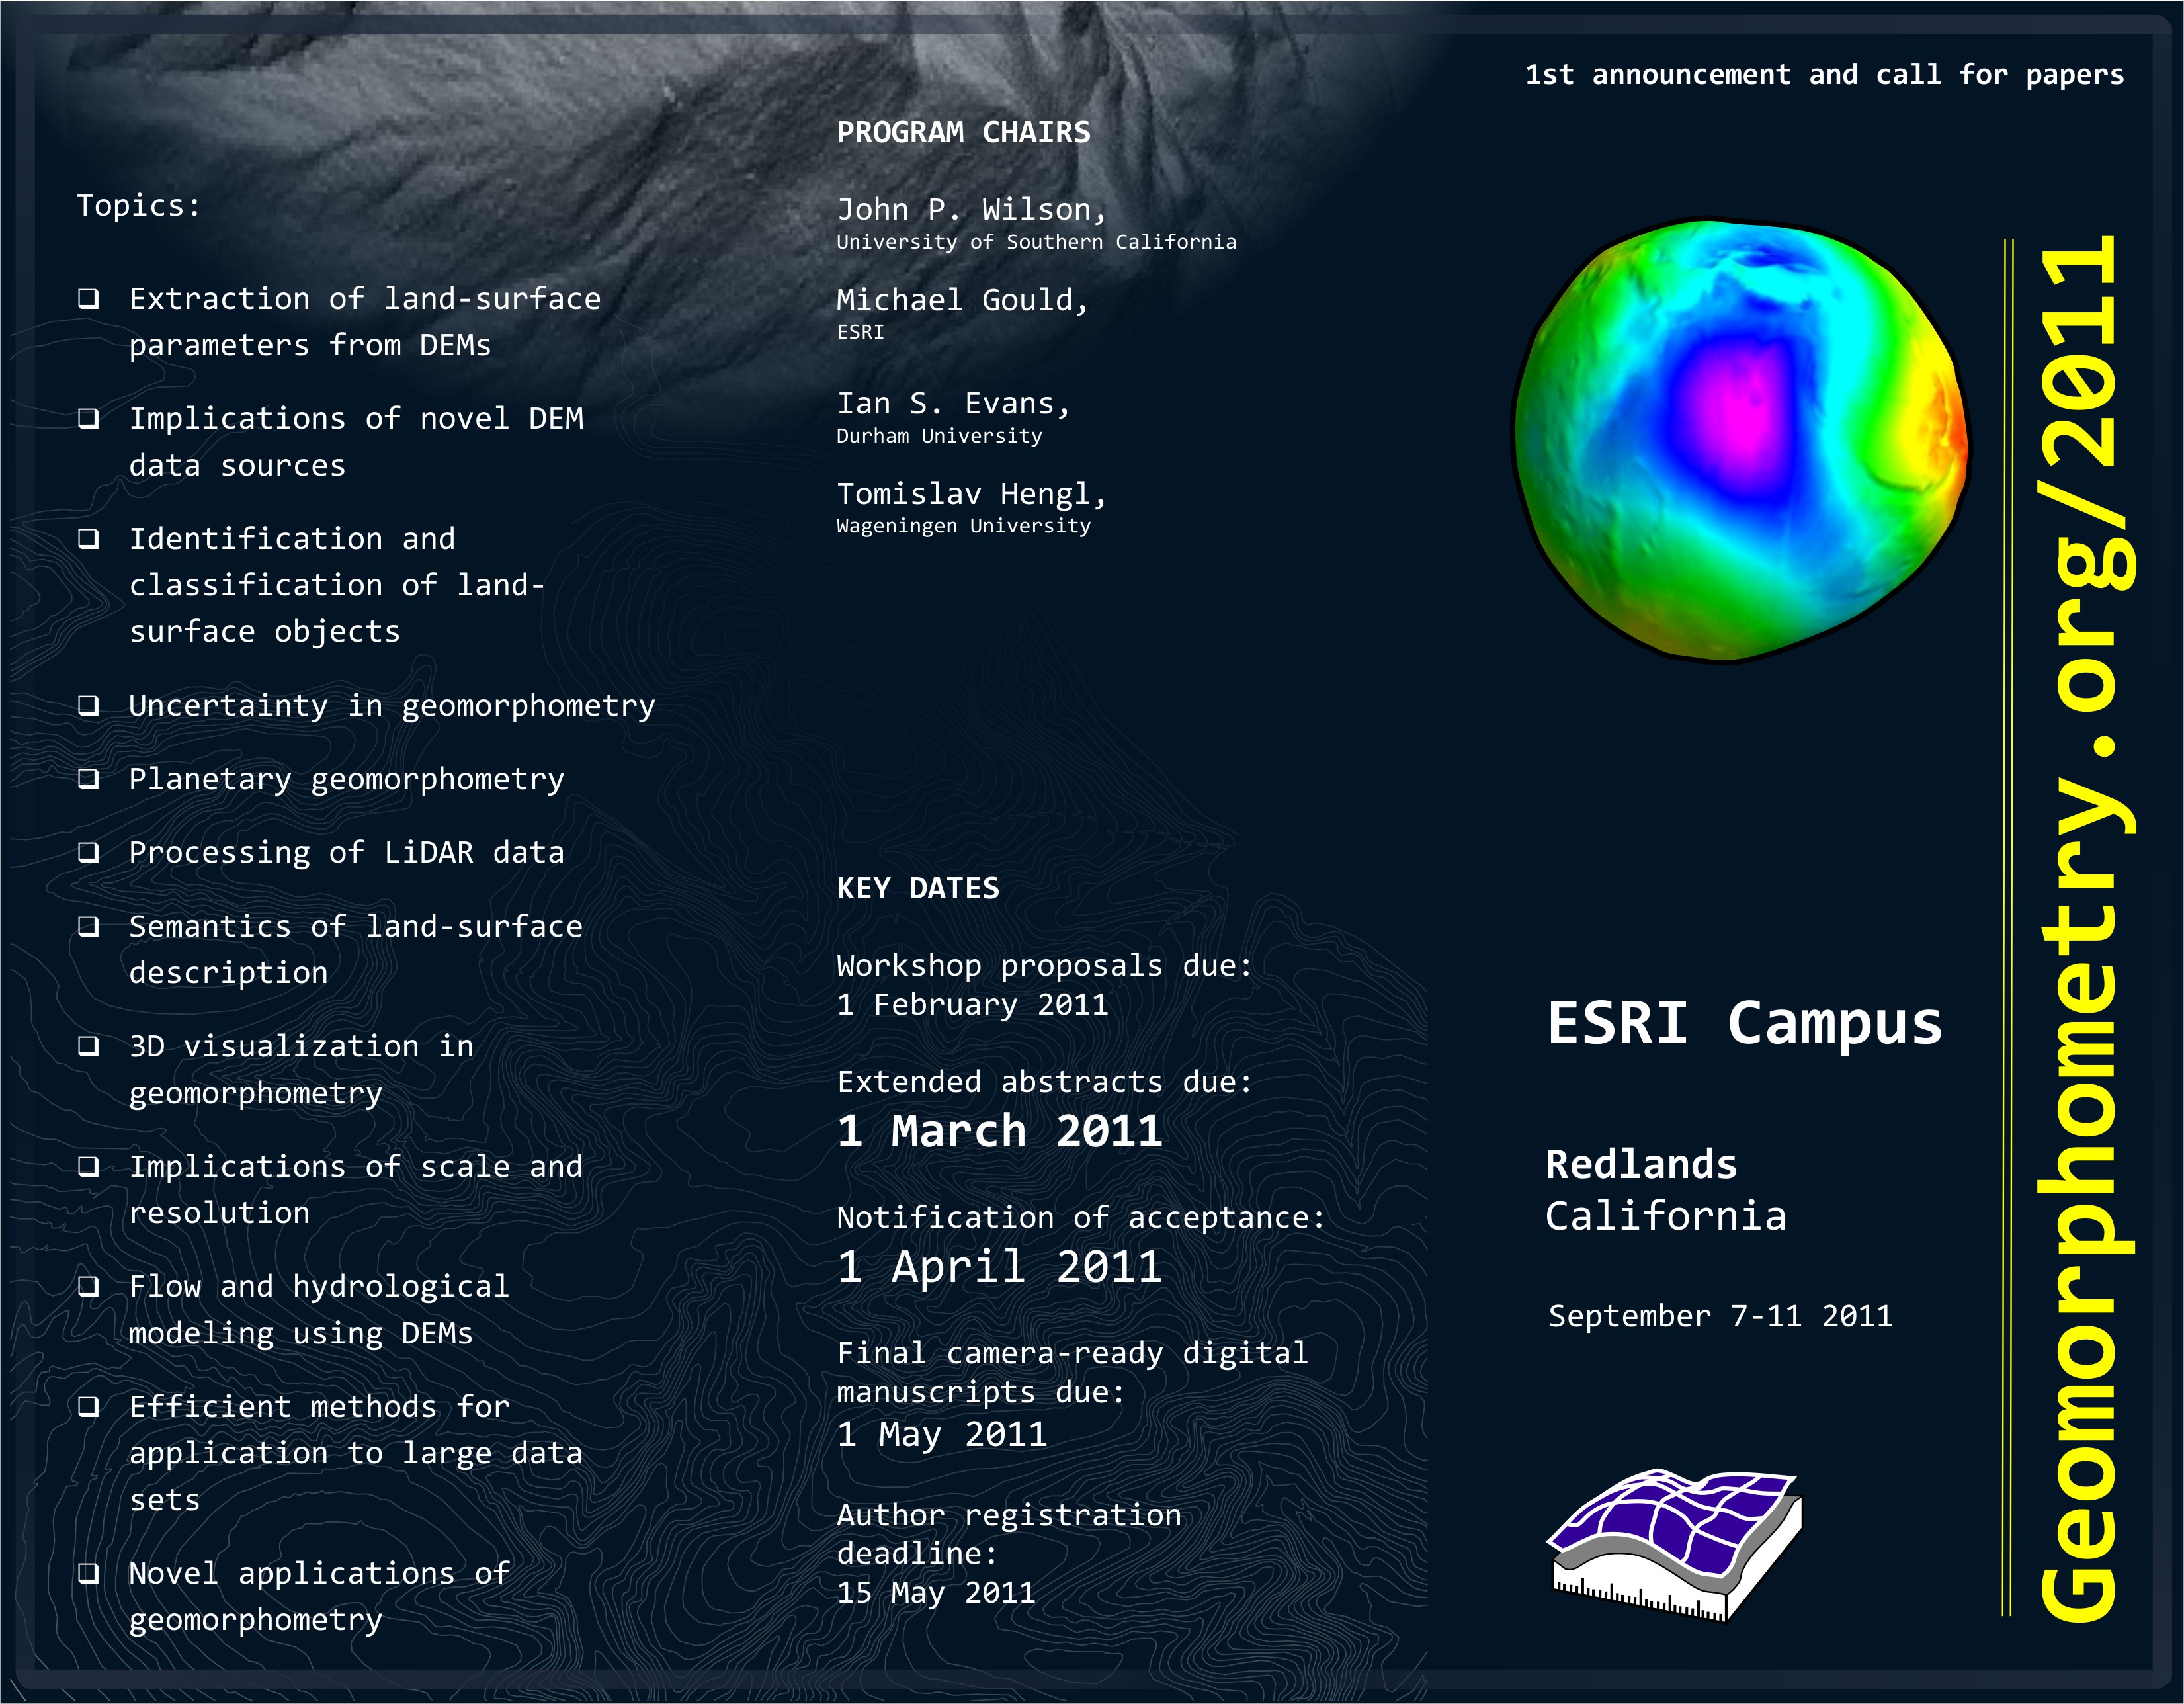
Geomorphometry 2011: Five days of Digital Terrain Analysis (Conference + Workshops)

September 7-11, 2011 (Wednesday to Sunday)

Building Q, ESRI Campus Redlands (map),
California, USA

http://geomorphometry.org/2011

e-mail: 2011@geomorphometry.org

For urgent matters please contact: Melisa Salido (the conference secretary)
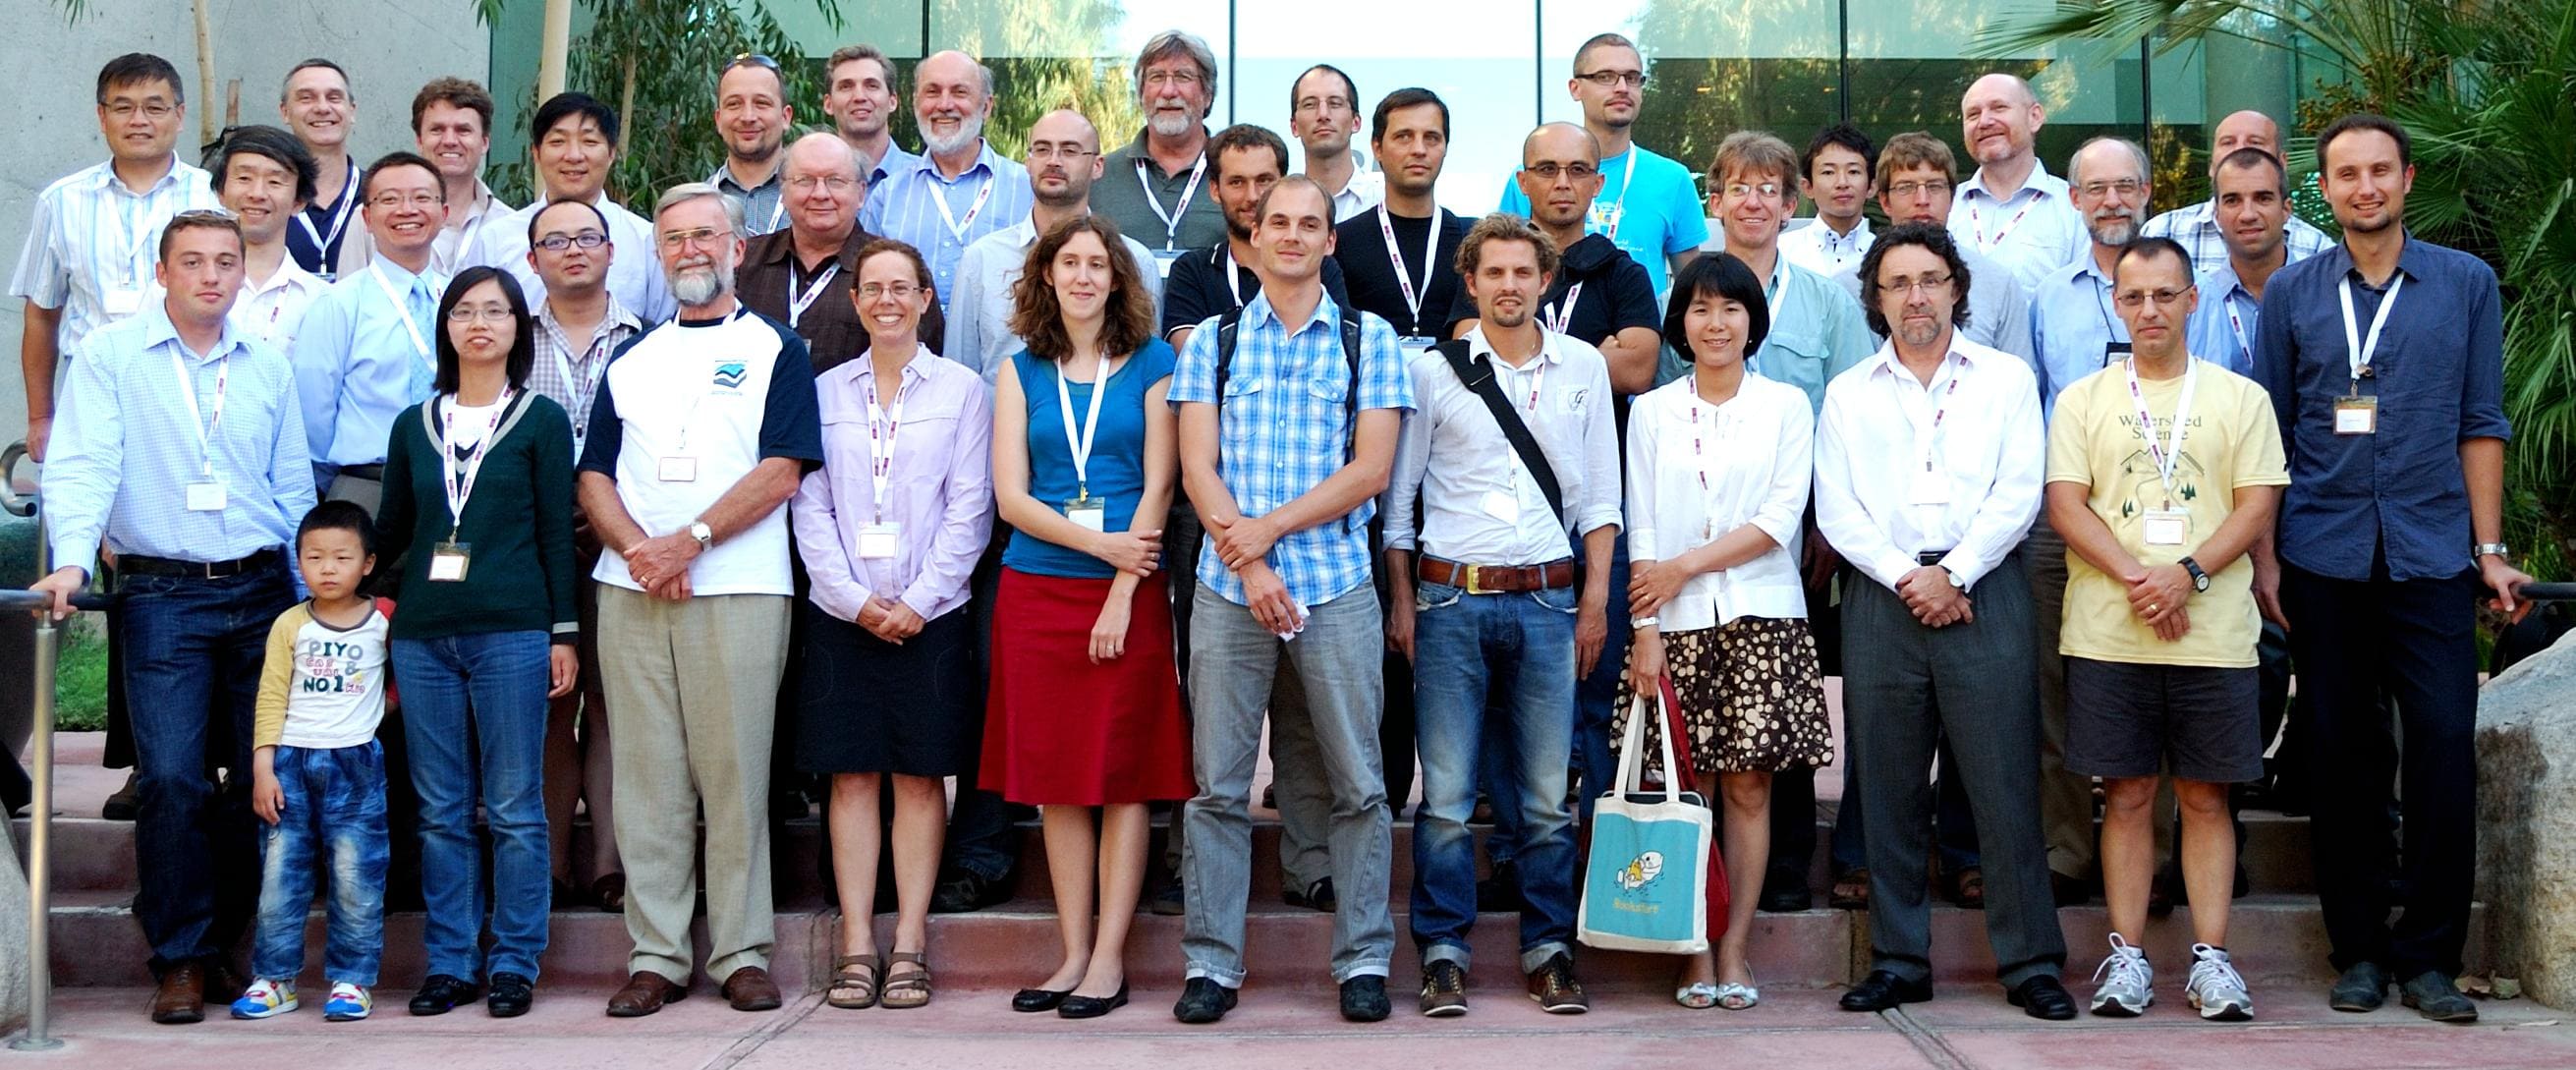
This event is sponsored by:

PROGRAM CHAIRS

  1. John P. Wilson, University of Southern California
  2. Michael Gould, ESRI
  3. Ian S. Evans, Durham University
  4. Tomislav Hengl, Wageningen University and Research

KEY DATES

  • Workshop proposals due: 1 Februrary 2011
  • Extended abstracts due: 1 March 2011
  • Late submission deadline: 15 March 2011
  • Notification of acceptance: 15 April 2011
  • Final camera-ready digital manuscripts due: 15 June 2011
  • Early registration deadline: 1st of July
  • Late registration deadline: at the conference (+$50 additional fee)

KEYNOTE SPEAKERS

  1. H Mitasova (7.09 morning)
  2. J Gallant (8.09 morning)
  3. Q Zhou (8.09 morning)
  4. T Oguchi (9.09 morning)
  5. A-Xing Zhu (9.09 morning)

AIMS AND SCOPE

The aim of Geomorphometry 2011 is to bring together researchers to present and discuss recent developments in the field of quantitative modelling and analysis of elevation data. Geomorphometry is the science of quantitative land-surface analysis and description at diverse spatial scales. It draws upon mathematical, statistical and image-processing techniques and interfaces with many disciplines including hydrology, geology, planetary geomorphology, computational geometry, geomorphology, remote sensing, geographic information science and geography. The conference aims to attract leading researchers in geomorphometry presenting methodological advances in the field and to provide young researchers with an opportunity to present new results.
Redlands is in San Bernardino County and at the eastern end of the S. Californian metropolis, some 100 km east of Los Angeles. It is between ‘The Badlands’ and the San Bernardino Mountains, beyond which is the Mohave Desert.
The Geomorphometry 2011 conference will continue a series initiated by the Terrain Analysis and Digital Terrain Modelling conference hosted by Nanjing Normal University in November 2006 and University of Zurich in 2009.

Possible topics include, but are not limited to:

  • Extraction of land-surface parameters from DEMs
  • Implications of novel DEM data sources
  • Identification and classification of land-surface objects
  • Uncertainty in geomorphometry
  • Planetary geomorphometry
  • Processing of LiDAR data
  • Semantics of land-surface description
  • 3D visualisation in geomorphometry
  • Implications of scale and resolution
  • Flow and hydrological modelling using DEMs
  • Efficient methods for application to large data sets
  • Novel applications of geomorphometry

CONFERENCE PROGRAMME

The conference programme will be based around a single track of papers, all of which will have been subject to review in the form of extended abstracts by members of the scientific committee. The conference programme is available at:

  • Conference programme (oral talks; 20 minutes)

The proceedings will be made available both digitally and as printed working materials to attendees at the time of the conference and archived online. A selection of papers will be invited for publication in a special issue of the Transactions in GIS.

WORKSHOPS

Geomorphometry will host two parallel workshops, each with ca. 5-10 attendees after the conference (Saturday day 4):

  • (Lucian Dragut & Clemens Eiseink) Discrete analysis of the land-surface: Burning issues and upcoming topics in linking geomorphometry with OBIA
  • (Tomislav Hengl & Carlos Grohmann) Automated analysis and visualization of elevation data using open source tools R+OSGeo

Workshops will take the form of either tutorials in a particular method or technique, or provide the opportunity for detailed discussion of upcoming topics. Workshops will be held in Lewis Hall rooms 102, 103, and/or 104. All rooms have ceiling-mounted 1080p-compatible projectors and screens, and white boards (and white board material cabinets covering 2-3 walls). Rooms 103 and 104 also have SmartBoards and auxiliary 42” 1080p monitors. For more info contact: Mark Kumler.

SUBMISSIONS

Prospective authors are invited to submit extended abstracts of up to 4 pages (ca 2000 words) by 1st of March 2011. Extended abstracts must be original works by the authors, not be currently under review in the same form by another outlet and not submitted elsewhere prior to the notification date.

  • Author guidelines

Authors that have missed the submission deadline for extended abstracts are invited to submit a poster. Up to 30 posters will be considered for a display during the poster blocks. For more info please read the author guidelines.

  • Submit a poster for the Conference

REGISTRATION FEES (CONFERENCE)

Registration fees (before 1st of July 2011):

  • $200.00 - Student Registration
  • $375.00 - Non-Student Registration
  • $300.00 - Student Registration w/ Workshop
  • $475.00 - Non-Student Registration w/ Workshop

*Click here to register. After you register for the conference and workshops, please add your name to the workshop pages -> sign-up (login to the geomorphometry.org, then go to the workshop of interest and select “sign-up”).

ACCOMMODATION (HOTELS)

We recommend staying at some hotel in the vicinity of the ESRI campus. When you make your reservations, please indicate that you are with the Geomorphometry Conference in order to get the discounted conference rate.

Ayres Hotel (ca. $99 per night)
1015 W. Colton Ave.
Redlands, CA 92374
+1-909-335-9024

Comfort Suites (ca. $80 per night)
1230 W. Colton Ave.
Redlands, CA 92374
+1-909-335-9988

Country Inn & Suites
1650 Industrial Park Avenue
Redlands, CA 92373
+1-909-792-7913

Need help with organizing your trip? Let us know about your arrival/departure times.

SCIENTIFIC COMMITTEE (active reviewers)

  1. Alexander Brenning, University of Waterloo, Canada
  2. Lucian Dragut, University of Salzburg, Austria
  3. Ian Evans, Durham University, UK
  4. Igor V. Florinsky, Institute of Mathematical Problems of Biology, Russia
  5. John Gallant, CSIRO, Australia
  6. Carlos H. Grohmann, University of Sao Paulo, Brazil
  7. Michael Gould, ESRI, USA
  8. Steve Kopp, ESRI, USA
  9. Robert A. MacMillan, ISRIC, the Netherlands
  10. Helena Mitasova, North Carolina State University, USA
  11. Brian Lees, University of New South Wales, Australia
  12. Allan James, University of South Carolina, USA
  13. Takashi Oguchi, University of Tokyo, Japan
  14. Scott Peckham, Rivix, USA
  15. Ross Purves, University of Zurich, Switzerland
  16. Hannes I. Reuter, ISRIC, the Netherlands
  17. Nicolas Tate, University of Leicester, UK
  18. Sebastiano Trevisani, University Iuav of Venice, Italy
  19. Lynn Usery, USGS Center for Excellence for GIS, USA
  20. John P. Wilson, University of Southern California, USA
  21. Jo Wood, City University, UK
  22. A-Xing Zhu, University of Wisconsin, USA

story event Redlands California USA

Share

Latest Posts

Whitebox Workflows Next Gen released

Whitebox Workflows Next Gen, a complete rewrite of the Whitebox geospatial analysis platform, is now publicly available for Python, R, and QGIS.

Built from the ground up in pure Rust, Whitebox Next Gen provides more than 700 geospatial analysis tools for geomorphometry, terrain analysis, spatial hydrology, LiDAR processing, remote sensing, vector GIS, and spatial statistics. All three interfaces run on the same high-performance backend, allowing users to work in scripts, notebooks, statistical workflows, or a familiar desktop GIS environment.

Whitebox Next Gen is not an incremental update to the previous Whitebox architecture. It replaces the earlier monolithic system with a modular, full-stack geospatial platform. Core capabilities for raster and vector I/O, coordinate systems and reprojection, vector topology, spatial indexing, LiDAR processing, and other foundational operations are implemented directly within the Whitebox codebase rather than delegated to external C or C++ GIS libraries. This approach provides consistent cross-platform behaviour, fewer system-level dependencies, tighter control over performance and correctness, and greater flexibility for continued research and development

Highlights

  • More than 700 tools for geomorphometry, hydrology, LiDAR, remote sensing, vector analysis, spatial statistics, and general geospatial processing
  • Publicly available interfaces for Python, R, and QGIS
  • A modular, high-performance backend written entirely in Rust, including wbprojection, wbraster, wbvector, wblidar, wbspatialstats, and wbtopology open-source (MIT/Apache licensed) backend libraries
  • Most of the 80+ tools that existed within the previous extension product have been migrated to the new Whitebox open core, including the tools for advanced surface curvature analysis and DEM processing
  • Native coordinate-reference-system handling and reprojection workflows via wbprojection
  • Expanded raster support (19 formats), including GeoTIFF, Cloud-Optimized GeoTIFF (COGs), GeoPackage Raster, and JPEG2000
  • Expanded vector support (12 formats), including Shapefile, GeoPackage, FlatGeobuf, GeoParquet, GeoJSON, TopoJSON, and GML
  • Modern point-cloud support, including LAS, LAZ, COPC, E57, and PLY
  • A dedicated topology engine supporting robust vector analysis, network analysis, route-event workflows, and linear referencing
  • Local-first processing on Windows, macOS, and Linux
  • A consistent analysis platform across Python scripts and R workflows
  • A newly updated and more advanced QGIS Processing toolbox

Whitebox has particular strengths in terrain analysis, geomorphometry, spatial hydrology, and LiDAR processing. Whitebox Next Gen carries these areas forward while substantially expanding the project’s capabilities for vector analysis, remote sensing, modern spatial data formats, and reproducible geospatial workflows.

Get started

The geomorphometry community is invited to explore Whitebox Next Gen, test its tools and workflows, report issues, and contribute to the continued development of the project.

DEMIX reveals which DEMs perform best

First round of the DEMIX exercise published final report

Global digital elevation models (DEMs) have become routine operational inputs across mapping, environmental monitoring, modelling and Earth-observation workflows. Their broad coverage and global availability have made them data that many practitioners simply take for granted. But knowledge of the terrain and topography of Earth’s surface is fundamental for monitoring and understanding terrestrial ecosystems and the planet’s habitability. For that reason, the CEOS Working Group on Calibration and Validation (WGCV) maintains a subgroup dedicated to digital topography and the quality of DEMs, the ‘Terrain Mapping Sub-Group (TMSG).

DEMs are representations of elevation in the form of a georectified grid, at global scale commonly derived from space-based interferometric synthetic aperture radar (InSAR) or stereoscopic optical observations, while regionally and locally airborne Laser induced detection and ranging (LIDAR) has become the primary source. DEMs can be classified as digital surface models (DSMs) when depicting the lower surface of the atmosphere or digital terrain models (DTMs) when depicting the top of the lithosphere (the Earth’s crust).

A wide variety of DEM products exist – each having different characteristics which suit different applications. It can be challenging to understand which of the available DEM products are fit for purpose for certain applications or regions. That is the practical gap addressed by the Digital Elevation Model Intercomparison Exercise (DEMIX) undertaken by TMSG. By exposing where widely used global DEMs agree, where they differ and how those differences affect rankings, the exercise delivered evidence to users for selecting a DEM rather than defaulting to one by habit.

DEM products were compared through a ‘wine contest,’ which identified requirements of openness, reproducibility, adaptability, and statistical rigour. The characteristics, evaluations, and ranking for each DEM were collected in a GIS database with over 50,000 entries. A quantitative assessment was carried out for each global DEM based on pixel-by-pixel differences of geomorphometric parameters against finer spatial resolution (1-5 m resolution) reference DEMs.

The study incorporates an unprecedented amount of high quality reference data covering a broad range of landforms and surface types, comparing their characteristics without resampling or interpolation. Users are invited to consult the results of DEMIX in order to make informed choices when needing to use a DEM, or in some cases a combination of the most relevant DEMs for their applications.

The final rankings of the wine contest, presented below, compared the six DEMs based on land cover (forest, urban, or barren), slope (cliff, steep, gentle, or flat), differences in elevation, slope and roughness, and statistical metrics.

Led by the European Commission’s Joint Research Centre (JRC), the CEOS Working Group on Calibration and Validation (WGCV) Terrain Mapping Subgroup (TMSG) established DEMIX in partnership with the International Society for Geomorphometry. Several members of the International Society of the Geomorphometry contributed significantly and we hosted various secssions at our latest conference. The exercise was performed over a three-year period starting in 2020, with community-wide calls for participation and an assembly of experts producing a number of peer-reviewed publications, culminating with a JRC reference report published in July 2026.

The objective of DEMIX was to propose a procedure to rank the available free and open global DEMs, taking into consideration user needs while promoting the implementation of FAIR (Findable, Accessible, Interoperable and Reusable) principles. The exercise compared DEMs based on criteria for land cover and terrain slope categories, representative testing, and a statistically sound ranking approach. The report outputs tailored recommendations regarding available DEM products that are not limited to one domain, geographic area, or landscape type, with flexibility for different user needs and applications.

A major challenge in the comparison of the global DEMs were the varying formats, data, and metadata contents. The adoption of a common set of standards would enhance the quality and interoperability of global DEMs and streamline the exchange and utilisation of DEM data for both providers and users. DEMIX makes the following recommendations for data providers:

● Adopt a standardised grid layout, with complete grid definitions and encodings following ISO/OGC rules.

● Include vertical datum information as part of raster DEM files.

● Clearly indicate the product version in the file names.

● Participate in future DEMIX rounds, which serve as a neutral platform for independently evaluating products before their release.

● Provide high quality, finer resolution, accurate, and multi-temporal elevation data to be used as a reference alongside DEM products.

Global DEMs are indispensable operational geospatial datasets, but they should not be treated as error-free or interchangeable. DEMIX delivered to the global community a systematic and transparent method to help choose elevation products more intelligently and help define what better elevation measurements should look like in the future.

Further Reading:

Read more in the DEMIX Final Report, or see other DEMIX publications below - mainly by our ISG members:

  • Benchmarking Elevation Plus Land Surface Parameters Finds FathomDEM and Copernicus DEM Win as Best Global DEMs (2025) and subsequent discussion (2026a, 2026b)
  • Ranking of 10 Global One-Arc-Second DEMs Reveals Limitations in Terrain Morphology Representation 2025
  • Novel Approach for Ranking DEMs: Copernicus DEM Improves One Arc Second Open Global Topography (2024)
  • Digital Elevation Models: Terminology and Definitions (2021)
  • The Digital Elevation Model Intercomparison eXperiment DEMIX, a community-based approach at global DEM benchmarking (2021)

Coffee Talk - GeoNadir

Building the world’s largest repository of FAIR drone mapping data

Paul Mead GeoNadir

September 2nd, 2026
11:30 (UTC)

Bio: Paul Mead is Co-founder and Head of Business & Strategy at GeoNadir, a platform building the world’s largest repository of FAIR drone mapping data to support environmental decision-making. A non-technical co-founder, Paul focuses on strategy, commercial development, and building high-performing teams — a discipline shaped by 11 years in the New Zealand Army, including leading a bomb disposal team in Lebanon and service in Afghanistan and the Asia-Pacific region. Since 2013 he has built and led several small businesses and start-ups, with drones as a central technology since 2016. Alongside GeoNadir, Paul co-founded She Maps, an internationally recognised drone and geospatial STEM education organisation, and has helped raise over $7M in equity and non-equity funding across his ventures. He holds a Master of Philosophy from the University of Queensland and is a Chartered Manager.

Abstract: GeoNadir set out to build the world’s largest repository of FAIR drone mapping data, and ended up building something more powerful. Drones have democratised data capture, but the same democratised ability to generate decision-grade insights from the data is lacking. I’ll walk through how we’re closing that gap: the data infrastructure behind hosting large volumes of UAV imagery and derived products, and how we’re moving from manual analysis toward automated, repeatable geospatial analytics.