Published: Feb 14, 2023 by ISG Board
Prepared by: Yu-Feng Ho (OpenGeoHub), Tom Hengl (OpenGeoHub) and Leandro Parente (OpenGeoHub)
Digital Terrain Model or Digital Land Surface Model is a digital raster map representing elevations of terrain / bare surface. NASA’s SRTM DEM used to be one of the most famous environmental layers in early 2000’s. In recent years a number of global public topography datasets at high spatial resolutions (30 m) have been released, from which Copernicus GLO-30 and ALOS AW3D30 are the two that can be considered new-generation elevation models. Too many versions of (basically the same) environmental data layer and too many landing pages can often confuse users and decrease the overall usability of such data. To simplify access and usability of such data we are building global Cloud-Optimized GeoTIFFs that are based on ensembling of multiple data sources, including national/regional datasets. Here is how you can access this data and contribute to the project.
To comment on this article please use the Medium version.
Rationale for a new global Ensemble DTM
In recent years a number of global public topography datasets at high spatial resolutions (30 m) have been released including GLO-30 and ALOS AW3D, and that is on top of the existing NASADEM, ASTER DEM, MERIT DEM and similar. For a complete inventory of global datasets best refer to the OpenTopography data catalog. Too many versions of (basically the same) environmental data layer and too many landing pages can often confuse users and decrease the overall usability of such data. In addition, most DEMs produced from remote sensing observations are only surface models requiring removal of canopy and similar objects. On the other hand, users typically require a single (most current, most accurate, most complete) terrain model that can then be used to produce all morphometric and hydrographic terrain variables across borders (see e.g. Amatulli et al., 2018; Amatulli et al., 2022). Previously, the most global consistent Digital model of Terrain (bare-earth or land surface) was the MERIT DEM, available at 100 m resolution (Yamazaki et al., 2017). Guth and Geoffroy (2021) compared multiple global DEMs for the world vs LiDAR points from ICESat and concluded that GLO-30 is most likely the most accurate DEM to date, but again it is a surface model and canopy needs to be removed before it can be used as a DTM.
Recently, a team at University of Bristol produced FABDEM (Forest And Buildings removed Copernicus DEM), basically the GLO-30 with buildings and forests removed by machine-learning. The correction algorithm was trained from a unique set of reference elevation from 12 countries, covering a wide range of climate zones and urban extents. Separate random forest models were implemented to estimate canopy height in forests and building height in urban areas and then GLO-30 subtracted height difference to produce FABDEM. This data set is described in detail in Hawker et al., (2022) and is available under CC-NC-SA license. An independent accuracy assessment of FABDEM is available in Dandabathula et al. (2022).
Likewise, our results for the Continental Europe have shown that machine learning can be used to remove canopy and buildings, although some post-processing is still needed to create hydrologically correct DTMs (Hengl et. al., 2020). Furthermore, number of national DTMs are now also available for large areas, such as Australia DTM, and USA DTM. Overall, there is a need for an Ensemble DTM that can incorporate multiple valuable datasets and post-processing done by different groups (e.g. MERITDEM).
To help reduce the complexity of global elevation datasets and make the data more usable, we have started working on a multipurpose Ensemble DTM for the world. The methods and how to access data (available under CC-BY license as ARCO — Analysis-Ready Cloud Optimized global mosaic) are outlined below.
Building the 30m Ensemble Terrain Model (EDTM30)
Although terrain can be estimated using ICESat / GEDI points as reference training data, we test here using a more simple procedure for building a DTM that allows for faster updates and easy additions of new data: using lower 10% probability quantile. Advantage of having an inexpensive setup to update Ensemble DTM (EDTM30) is that we could possibly run nightly updates i.e. as soon as countries / regions submit locally produced terrain models.
Why 10% lower quantile? We basically assume that terrain heights are at the lower part of the distribution, so we simply derive lower 10% quantile from multisource data as shown below. We assume that, because canopy is difficult to remove and still remains even in MERITDEM and FABDEM (Dandabathula et al., 2022), deriving 10% lower quantile can further help filter out potential canopy remains.
This is of course a simplification and an arbitrary chosen number. Although computationally efficient, there is no guarantee that using lower 10% quantile will remove all canopy problems (e.g. all forests) hence it is important to first remove any pixels that significantly oscillate from MERITDEM. In addition, we here also assume that both AW3D and GLO-30 are the same quality, which might not be true for different parts of the world.

A simple procedure used to derive an Ensemble estimate of the terrain elevation.
We run processing, described in the flow chart above, tile by tile (1000 x 1000 pixels). In summary the process works as follows:
-
We first derive standard deviation (s.d.) using the list of DEMs (new map).
-
For GLO-30, ALOS, we remove all pixels where s.d. values are >6 m (60 dm) i.e. [sd(GLO, ALOS, MERIT, NDTM) > 6 m] AND/OR where canopy height is >2m; for those pixels we assign a NA value i.e. we assume these are DSM or erratic values. Note: for Canopy height a global 30 m layers is provided by UMD GLAD (Potapov et al., 2021).
-
We next derive a lower 10% quantile from the 5 values (GLO, ALOS, MERIT, NDTM). This is then the EDTM i.e. the most probable bare-earth elevation.
-
We also derive standard deviation using the 5 values; which can be used as the uncertainty map. If there is only one value of DEM in the list, we assign the value -1.
The process of deriving the best estimate of DTM is fully documented and automated in this Python script. At the moment it can be used to generate an ensemble DTM within 5 hrs running on a fully parallelized HPC center with cca 1050 threads. Final mosaic of the world is a massive 200GB dataset and still takes significant time to compile a COG:

Dimensions and technical properties of the global mosaic at 30 m spatial resolution.
A demonstration of the maps used and the results obtained (EDTM) is shown below:
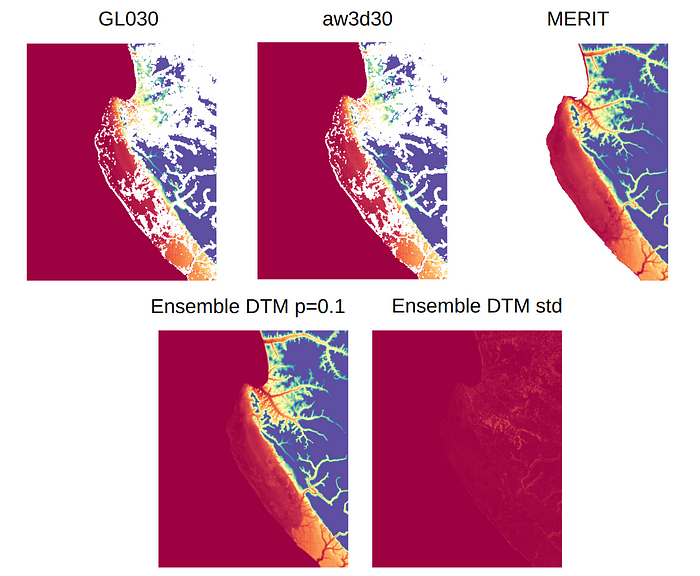
Three original input DEMs. GLO-30 and AW3D30 can be considered to be Digital Surface Models, hence canopy and buildings would need to be removed before it can be used.
In the last stage we compile all output layers as Analysis-Ready-Cloud-Optimized (ARCO) GeoTiff. This gives on the two final layers (1) EDTM in metre (m), and (2) standard deviation showing biggest discrepancies between AW3D, GLO-30, MERITDEM, and national DTMs. The two output COGs are shown below.

Ensemble DTM in 30m.
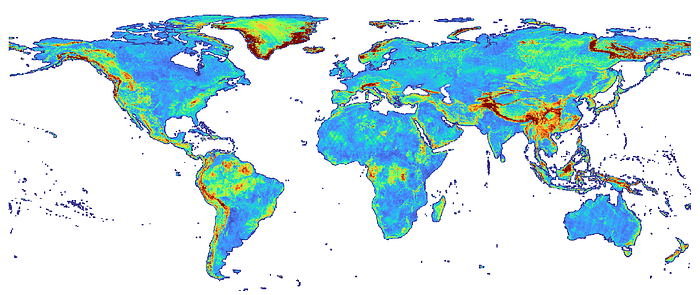
Standard deviation of Ensemble DTM in 30 m. This only shows how much the elevation differs from the multisource input data. Note that the highest errors can be noticed in areas with high complex relief i.e. Alps, Himalayas, but also in areas covered with dense vegetation (tropical forests).
Access and test using the Ensemble DTM (EDTM) of the world
Interested to test the usability and accuracy of this data? To access this dataset seamlessly, without requiring to download the whole dataset (+200GB) or tiles that then need to be combined manually, we have further converted the global mosaic to COG files and uploaded them to our S3 repository.
To cite this EDTM please use the following reference:
- Ho, Y.-F., Hengl, T., Parente, L., (2023). Ensemble Digital Terrain Model (EDTM) of the world (Version 1.1) [Data set]. Zenodo. https://doi.org/10.5281/zenodo.7634679
To access the Ensemble DTM at 30-m, you could copy these link and open in QGIS:
-
10% lower quantile image: https://s3.eu-central-1.wasabisys.com/openlandmap/dtm/dtm.bareearth_ensemble_p10_30m_s_2018_go_epsg4326_v20230221.tif
-
Standard deviation image: https://s3.eu-central-1.wasabisys.com/openlandmap/dtm/dtm.bareearth_ensemble_std_30m_s_2018_go_epsg4326_v20230221.tif
Important note: probably there is no need to download the whole tif as it is 200+ GB in size. To open this layer in QGIS and resample or subset / crop to area of interest, follow these steps: open QGIS -> “Layer” -> “Add Layer” -> “Add Raster Layer”, and click Protocol: HTTP(S), cloud, etc., paste the url from above at URL, and click “Add” button.

Panel to add Ensemble DTM in QGIS (Layer » Add Layer » Add Raster Layer)
To derive local DTM parameters we advise using some equidistant projection e.g. the Equi7 gridding system. To extract part of the DTM best use the following code (e.g. for TILE:E038N093T1 in Equi7Grid or similar:
gdal_translate -a_srs ‘+proj=aeqd +lat_0=8.5 +lon_0=21.5 +x_0=5621452.01998 +y_0=5990638.42298 +datum=WGS84 +units=m +no_defs’ -projwin 3700000 9300000 3800000 9200000 https://s3.eu-central-1.wasabisys.com/openlandmap/dtm/dtm.bareearth_ensemble_p10_30m_s_2018_go_epsg4326_v20230221.tif ensemble_dtm_equi7_af_tile.E038N093T1.tif
To derive hillshade for this tile, QGIS provides Hillshade function. You can find it from QGIS -> “Raster” -> “Analysis” -> “Hillshade”.

Ensemble DEM and derived Hillshade.
For python programmers, here is a jupyter script to access data, crop and generate hillshade in Python.
Report a problem / help us improve the modeling framework
The OpenLandMap Github repository contains all information how the data was produced (see the repository). If you discover a bug, artifact, or inconsistency, it is always welcome to create a new issue using the Github repository and upload a screenshot or similar showing where the problem might be.
If you are aware of some national dataset that we could also add to the list of inputs for ensembling, please also register it as an issue. We only require that the input data license allows us to produce derivative datasets and to release them under an open data license (CC-BY, CC-BY-SA and/or ODbL). In addition, receiving your data as a GeoTIFFs with internal compression, also helps speed up the process. If you are producing LiDAR-based on similar topographic data and do not know where to publish / host them, we recommend submitting your data directly to https://portal.opentopography.org/dataCatalog.
Data license and terms of use
This data is provided under the Creative Commons Attribution CC-BY license. This dataset is under development. Use at own risk.
In the previous version we have tested using FABDEM data set for building EDTM but this data set has been removed due to copyright concerns by the FABDEM data owners. Every effort has been made to trace copyright holders of the materials used to produce these layers. Should we, despite all our best efforts, have overlooked contributors please contact the OpenGeoHub Foundation and we will correct this unintentional omission without delay and will acknowledge any overlooked contributions and recognize new contributors in future updates.
Acknowledgements
This work has been funded by OEMC project The Open-Earth-Monitor Cyberinfratructure project, which has received funding from the European Union’s Horizon Europe research and innovation programme under grant agreement № 101059548.
References:
-
Amatulli, G., Domisch, S., Tuanmu, M. N., Parmentier, B., Ranipeta, A., Malczyk, J., & Jetz, W. (2018). A suite of global, cross-scale topographic variables for environmental and biodiversity modeling. Scientific data, 5(1), 1–15.
-
Amatulli, G., Garcia Marquez, J., Sethi, T., Kiesel, J., Grigoropoulou, A., Üblacker, M. M., … & Domisch, S. (2022). Hydrography90m: A new high-resolution global hydrographic dataset. Earth System Science Data, 14(10), 4525–4550.
-
Dandabathula, G., Hari, R., Ghosh, K., Bera, A. K., & Srivastav, S. K. (2022). Accuracy assessment of digital bare-earth model using ICESat-2 photons: analysis of the FABDEM. Modeling Earth Systems and Environment, 1–18.
-
Geoscience Australia (2015). Digital Elevation Model (DEM) of Australia derived from LiDAR 5 Metre Grid. Geoscience Australia, Canberra. https://doi.org/10.26186/89644
-
Guth, P. L., & Geoffroy, T. M. (2021). LiDAR point cloud and ICESat‐2 evaluation of 1 second global digital elevation models: Copernicus wins. Transactions in GIS, 25(5), 2245–2261.
-
Hawker, L., Uhe, P., Paulo, L., Sosa, J., Savage, J., Sampson, C., & Neal, J. (2022). A 30 m global map of elevation with forests and buildings removed. Environmental Research Letters, 17(2), 024016.
-
Hengl, T., Leal Parente, L., Krizan, J., & Bonannella, C., (2020). Continental Europe Digital Terrain Model at 30 m resolution based on GEDI, ICESat-2, AW3D, GLO-30, EUDEM, MERIT DEM and background layers (v0.3) [Data set]. Zenodo. https://doi.org/10.5281/zenodo.4724549
-
Potapov, P., Li, X., Hernandez-Serna, A., Tyukavina, A., Hansen, M. C., Kommareddy, A., … & Hofton, M. (2021). Mapping global forest canopy height through integration of GEDI and Landsat data. Remote Sensing of Environment, 253, 112165.
-
Yamazaki, D., Ikeshima, D., Sosa, J., Bates, P. D., Allen, G. H., & Pavelsky, T. M. (2019). MERIT Hydro: a high‐resolution global hydrography map based on latest topography dataset. Water Resources Research, 55(6), 5053–5073.
-
Yamazaki, D., Ikeshima, D., Tawatari, R., Yamaguchi, T., O’Loughlin, F., Neal, J. C., … & Bates, P. D. (2017). A high‐accuracy map of global terrain elevations. Geophysical Research Letters, 44(11), 5844–5853.