Blog

NASA Sea level projection tool

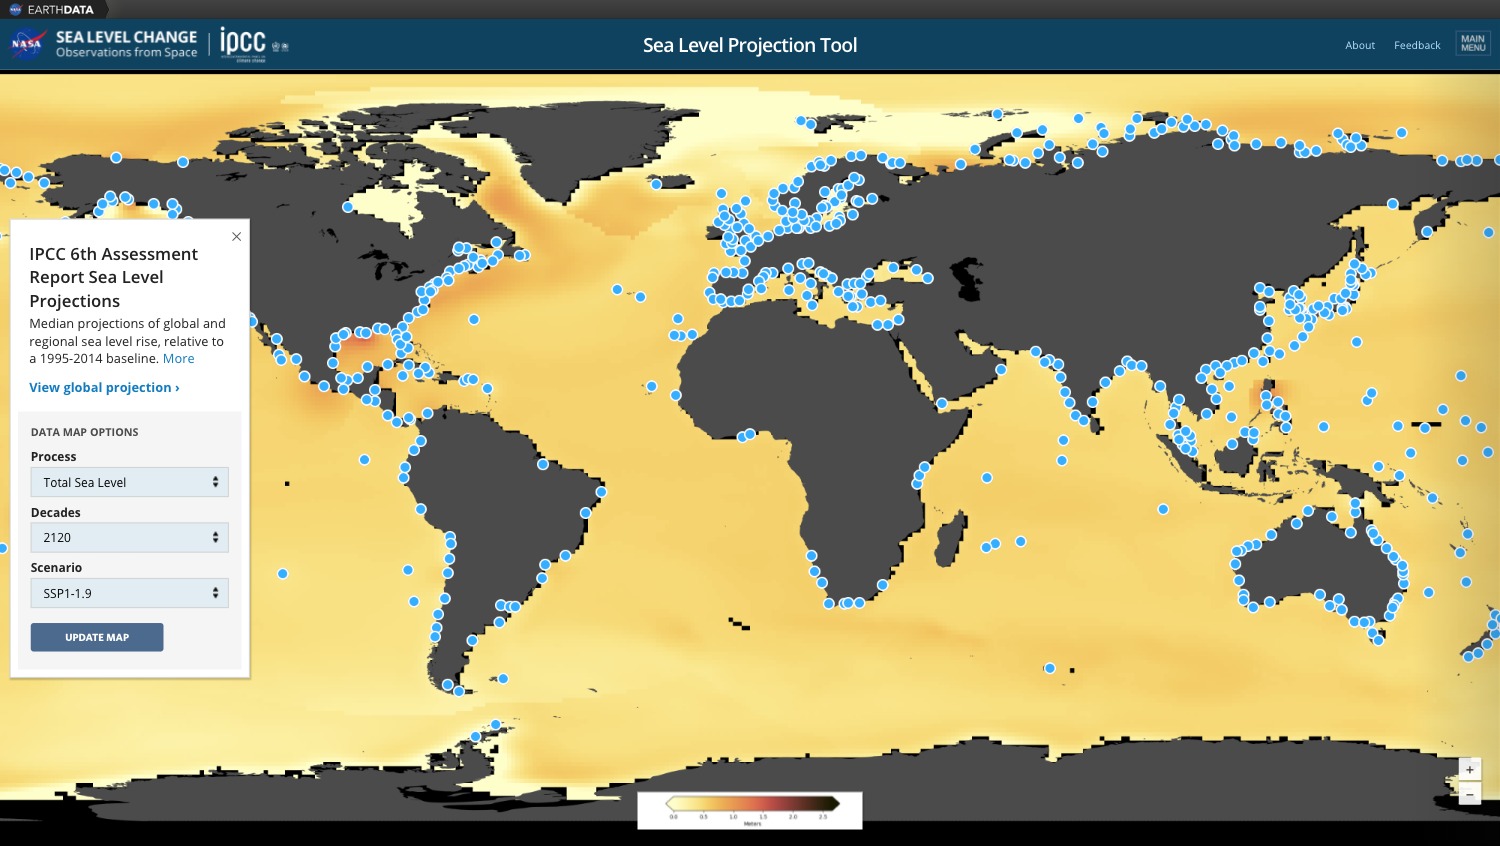
NASA has recently released an interactive webmapping tool to explore effect of global warming on the sea level rise and potential risks / damages associated.

“The NASA Sea Level Projection Tool allows users to visualize and download the sea level projection data from the IPCC 6th Assessment Report (AR6). The goal of this tool is to provide easy and improved access and visualization to the consensus projections found in the report. The target audience is intended to be broad, allowing a general audience and scientists alike to interact with the information contained in the AR6.”

To learn more about method and Digital Terrain Model source used for modeling, please refer to:

  • Fox-Kemper, B., H. T. Hewitt, C. Xiao, G. Aðalgeirsdóttir, S. S. Drijfhout, T. L. Edwards, N. R. Golledge, M. Hemer, R. E. Kopp, G. Krinner, A. Mix, D. Notz, S. Nowicki, I. S. Nurhati, L. Ruiz, J-B. Sallée, A. B. A. Slangen, Y. Yu, (2021). Ocean, Cryosphere and Sea Level Change. In: Climate Change 2021: The Physical Science Basis. Contribution of Working Group I to the Sixth Assessment Report of the Intergovernmental Panel on Climate Change [MassonDelmotte, V., P. Zhai, A. Pirani, S. L. Connors, C. Péan, S. Berger, N. Caud, Y. Chen, L. Goldfarb, M. I. Gomis, M. Huang, K. Leitzell, E. Lonnoy, J. B. R. Matthews, T. K. Maycock, T. Waterfield, O. Yelekçi, R. Yu and B. Zhou (eds.)]. Cambridge University Press. In Press.

Copernicus Digital Elevation Model (DEM) as Open Data on Amazon AWS and Sentinel-Hub

European Space Agency (ESA) has recently made available two global Digital Surface Models:

  • GLO-30: the 30-m spatial resolution DSM,
  • GLO-90: the 90-m spatial resolution DSM,

Both are available for download from cdsdata.copernicus.eu on a free basis for the general public under the terms and conditions of the Licence found here.

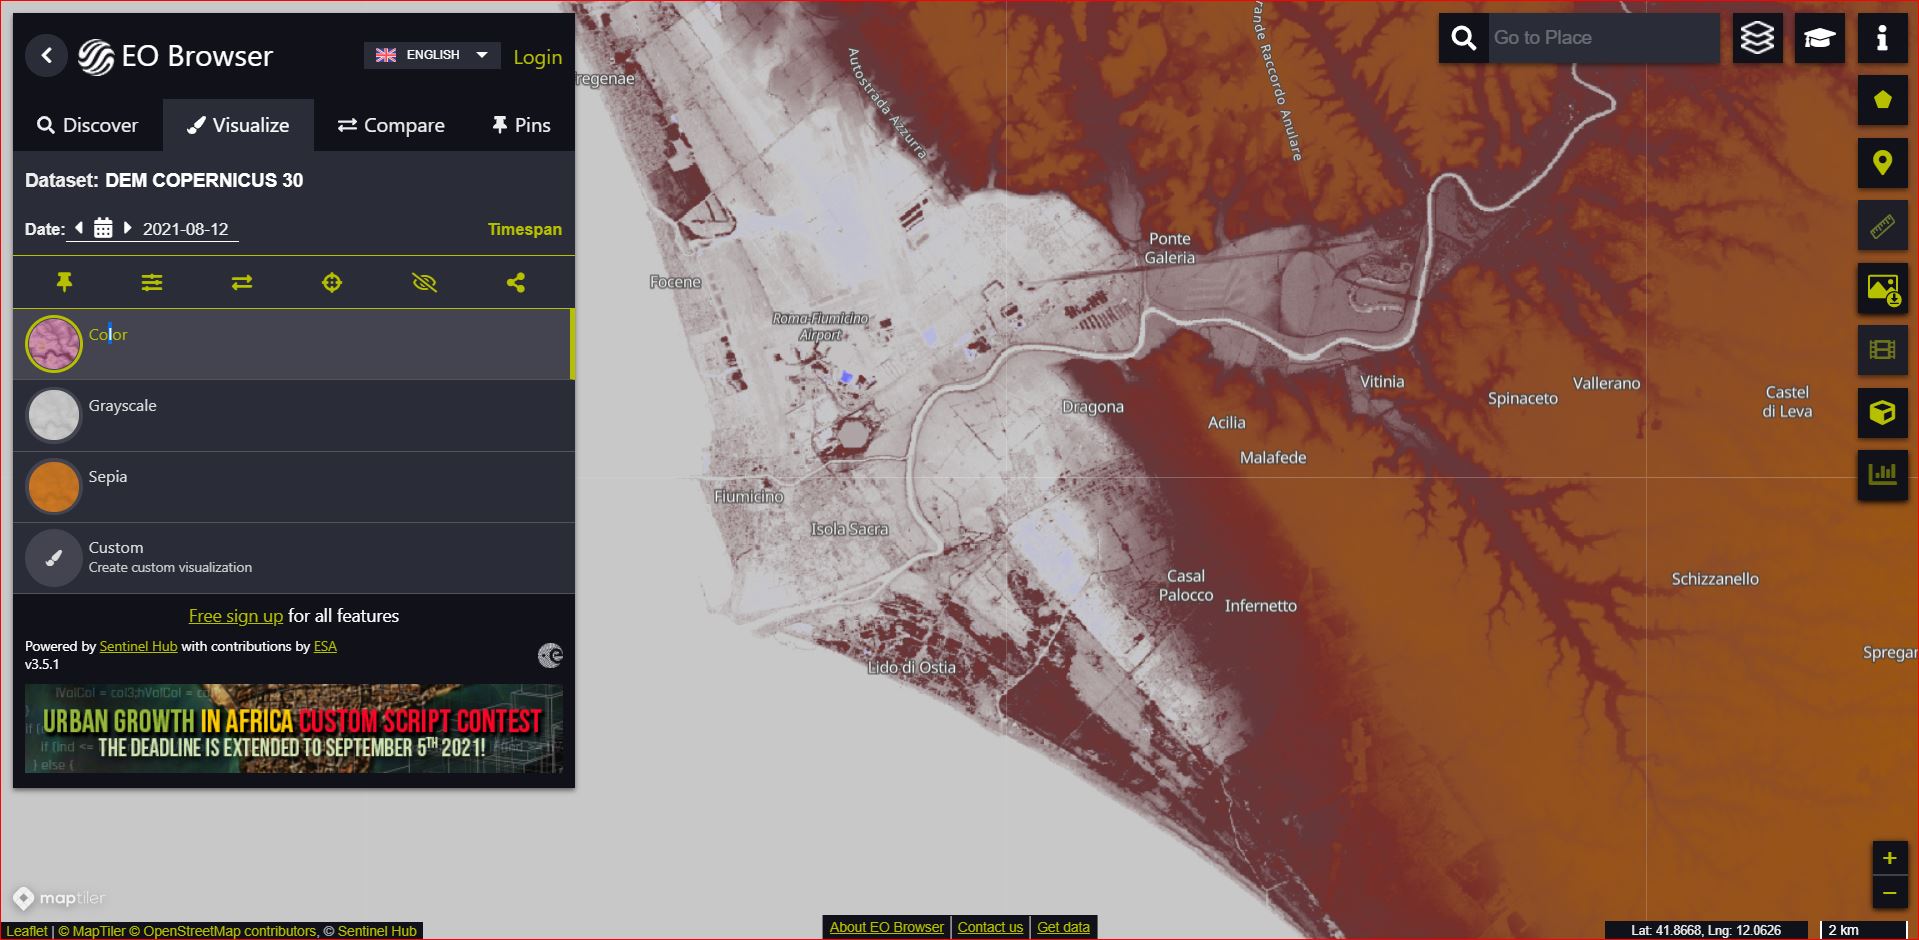
A copy of the GLO-30 and GLO-90 is now also available as Cloud Optimized GeoTIFFs from the Amazon AWS public data repository. The visualization shown above is from the sentinel-hub.com.

To learn more about the GLO-30 and it’s accuracy and production, refer to this article.

Continental Europe Digital Terrain Model at 30 m resolution based on multisource data

Within the OpenDataScience.eu (Geo-harmonizer) project we have recently produced an Digital Terrain Model for Continental Europe based on the four publicly available Digital Surface Models: MERITDEM, AW3D30, GLO-30, EU DEM. This is basically an Ensemble Machine Learning approach where GEDI level 2B points (Level 2A; “elev_lowestmode”) and ICESat-2 (ATL08; “h_te_mean”) were used to train a multisource model to predict “most probable height of terrain” including the prediction errors per pixel.

So which of the four big global DEM’s is the best match with terrain heights? Our results indicate that it is the MERITv1.0.1 (originally available at 90-m, but was downscaled here to 30-m using cubic splines) followed by the AW3Dv2012 and GLO-30. This confirms that Yamazaki et al. (2017) have done an excellent work in filtering out canopy and artifacts in the original SRTM/AWD30 data.

Read more about MERIT DEM in:

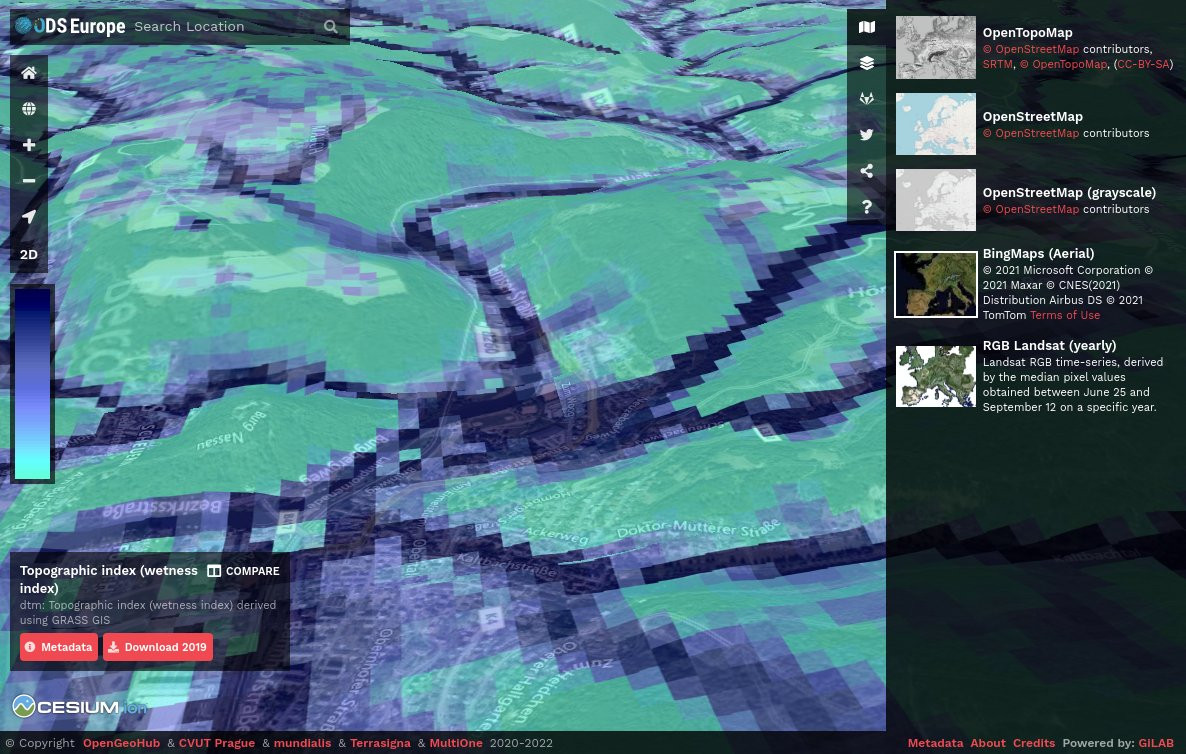
To access the Continental Europe Digital Terrain Model at 30-m please visit https://maps.opendatascience.eu and select “terrain” from the layer menu.

You can also download the DTM for EU including the regression matrix with all training points (GEDI/ICESat) via:

Your opinion on object-based classification of topography - Evaluation still possible!

WEB APPLICATION and QUESTIONNAIRE at http://zgis205.plus.sbg.ac.at/PhysiographicClassificationApplication/default.aspx

Dear colleagues, We kindly ask for your help in evaluating the preliminary outputs of a global physiographic classification. The methodology has been designed for general purposes. We hope, however, that the results can be tuned to specific applications, by using the object attributes, without a need of running the classification again. Potential domains of application include Landscape Ecology, Ecology, Geomorphology, Geology, Hydrology, Soil Science, and Agriculture. Your evaluation would be useful in improving the current classification. The results of your evaluation will be part of a paper we intend to submit to a peer-reviewed journal. Classification results are embedded within a web application available at the following address

http://zgis205.plus.sbg.ac.at/PhysiographicClassificationApplication/default.aspx.

You can visualize the results and let us know your opinion by filling in the form under the red button named ‘Please provide your feedback here.’ Apart of the classification itself, i.e. to which degree classes describe correctly given regions, we would like you evaluating the quality of object boundaries, i.e. to which degree boundaries match topographic discontinuities. After evaluation, both the database and the tool will be released for free download.

Please find below additional details on the methods and the web application.

GDEM - a quick assessment

The first 30 m resolution global ASTER-based DEM (GDEM) has recently been released. This is now the most detailed global GIS layer with public access (read more). The GDEM was created by stereo-correlating the 1.3 million-scene ASTER archive of optical images, covering almost 98% of Earth’s land surface (claimed 95% vertical accuracy: 20 meters, 95% horizontal accuracy: 30 meters). The one-by-one-degree tiles can be downloaded from NASA’s EOS data archive and/or Japan’s Ground Data System. The download of DEMs for large areas is at the moment difficult and limited to 100 tiles.

I have downloaded some GDEM tiles for the areas in the Netherlands, Italy, Serbia and USA, and compared these with the most accurate LIDAR-derived DEMs (aggregated to 25 m resolution) available for the same area. The data used for comparison and shown in plot below can be obtained from here. I was interested to see how accurate is the GDEM and what are the main limitations of using it for various mapping applications.

Conceptually speaking, accuracy of topography (or better to say relief) can be represented by examining (at least) the following three aspects of a DEM:

  • Accuracy of absolute elevations (simply the difference between the GDEM and true elevation);
  • Accuracy of hydrological features (deviance of stream networks, watershed polygons etc. from true lines);
  • Accuracy of surface roughness (deviance of the nugget variation and/or difference in local relief quantified using e.g. difference from the mean value);

Fig: Comparison of the GDEM and LiDAR-based DEMs for four study areas: (1) fishcamp; (2) zlatibor; (3) calabria, and (4) boschord (all maps prepared in resolution 25-30 m).

The results of this small comparison show that:

  1. The average RMSE for elevations for these for data sets is: 18.7 m;
  2. The average error of locating streams is between 60-100 m;
  3. Surface roughness is typically under-represented so that the effective resolution of GDEM is possibly 2-3 times coarser than the actual;

In addition, by visually comparing DEMs for the four case studies, you will notice that GDEM often carries some artificial lines and ghost-like features (GDEM tiles borders, vegetation cover etc.). The worst match between the GDEM and LiDAR-based DEM (reality) is in areas of low relief (boschord). Practically, GDEM looks to be of absolutely no use in areas where the average difference in elevations is <20 m. As the producers of GDEM themselves indicated: “The ASTER GDEM contains anomalies and artifacts that will reduce its usability for certain applications, because they can introduce large elevation errors on local scales”.

In summary, I can only conclude that (a) there is still a lot of filtering to be done with GDEM to remove the artificial breaks and ghost lines; (b) the effective resolution of the GDEM is probably 60-90 m and not 30 m, hence the whole layer should be aggregated to a more realistic resolution; (c) the first impression is that GDEM is not more accurate than the 90 m SRTM DEM, especially if one looks at the surface roughness and land surface objects. On the other hand, the horizontal accuracy of GDEM is more than satisfactory and GDEM has a near to complete global coverage, so that it can be used to fill the gaps and improve the global SRTM DEM. In addition, the GDEM comes also with a quality assessment (QA) map. Each QA file pixel contains either: (1) the number of scene-based DEMs contributing to the final GDEM value for each 30 m pixel (stack number); or (2) the source data set used to replace identified bad values in the ASTER GDEM.
Latest Posts

Cover Design Contest for the Upcoming Book on Geomorphometry

Dear geomorphometry community,

We are pleased to invite submissions for a cover design contest for the second edition of the Geomorphometry book, to be published in 2026.

The submissions will be gathered in a poll, and the entire community will be able to vote for their favorite design.

If your design is selected, you will receive the appropriate credits, but would need to provide the necessary permissions to use the image.

You can submit your design by email before October 17th. Please ensure that the image is of at least 300 dpi resolution.

Get designing!

The editors,
Hannes Reuter
Carlos Grohmann
Vincent Lecours

Coffee Talk - Recent Research Progress in Geomorphometry in China

Recent Research Progress in Geomorphometry in China

Dr. Li-Yang Xiong
Nanjing Normal University, China

October 1st , 2025
8:00 MDT (UTC -6), 10:00 EDT (UTC -4), 11:00 BRT (UTC - 3), 15:00 BST (UTC +1), 16:00 CEST (UTC +2), 17:00 EEST (UTC +3), 22:00 CST (UTC +8)

Recording available in our YouTube channel

Bio: Dr. Li-Yang Xiong is a professor at the School of Geographical Science, Nanjing Normal University (NNU), China. He is currently responsible for managing NNU’s research in Digital Terrain Model and Digital Terrain Analysis. His main research interests include AI based terrain modelling, loess terrain feature characterization, landform evolution modeling, paleotopography reconstruction and geomorphological process mining. His recent work involves deep learning-based DEM reconstruction, geomorphology-oriented digital terrain analysis, and value-added digital terrain applications for geoscience. He also serves as Associate Editor for the journal Earth Surface Processes and Landforms and as an Editorial Board Member for International Journal of Geographical Information Science.

Abstract: In this talk, I will present some recent research achievements related to terrain modelling theory, terrain analysis method and terrain application in China. This terrain modeling theory focused on how we understand terrain knowledge and integrate it into AI methods for terrain reconstruction. In term of the terrain analysis method, the mathematical vector operation we believe should be highlighted in the research of Geomorphometry, which is suitable for multi-source data structure by considering the directional property of terrain parameters. Actually, this directional property should be made a full consideration for process- oriented geographical modeling and simulation. Lastly, I will show some terrain applications towards different typical geographical areas in China as well as global scale application.

PHD position in Italy

Dear colleagues,

I’m grateful if you can circulate information on this PhD opportunity in Italy. The potential candidates can contact me (strevisani@iuav.it) for further information. Here the main elements of the position:

Research topics: Predicting and supporting benthic and pelagic biodiversity through geomorphometry and machine learning

Link to the call (Italian and English): https://www.unipa.it/didattica/dottorati/dottorato-xli/bando-di-accesso-ciclo-41/

Position code [BIODIV.OGS]

Research headquarters OGS Trieste and University of Palermo

Funded by OGS - Istituto Nazionale di Oceanografia e di Geofisica Sperimentale

Key dates: Deadline: 7th August 2025 - 14:59 (Italian time)