Start: Aug 31 2009 - 09:15End: Sep 2 2009 17:30
Timezone: Europe/Amsterdam
Programme
Monday 31.08.2009
Tuesday 1.09.2009
Wednesday 2.09.2009
Start: Aug 31 2009 - 09:15End: Sep 2 2009 17:30
Timezone: Europe/Amsterdam
Monday 31.08.2009
Tuesday 1.09.2009
Wednesday 2.09.2009
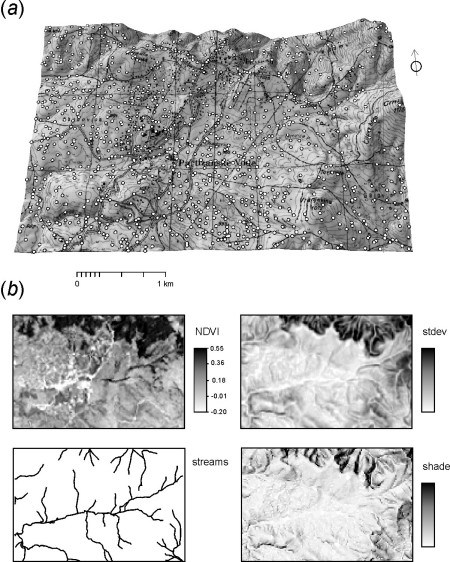
The case study area ‘Zlatibor’ is located in the South-western part of Serbia (centred at 43°43’44.6’‘N and 19°42’37.8’‘E). The area is mainly hilly plateau, with the exception of the north-east part where the slopes are much steeper. Elevations range from 850 m to a maximum of 1174 m; the total size of the area is 13.5 square kilometers.
Study area Zlatibor: (a) perspective view on the area (1:25,000 topo-map) and location of 1020 error assessment points, (b) a preview of the auxiliary predictors used for the geostatistical modeling
Available layers:
- elevations.txt - a set of 2051 height measurements used for generation of DEMs;
- control.txt - a set of 1020 very precise spot heights used for error assessment;
- dem30.asc - the original topo-map DEM at 30 m resolution;
- SRTMDEM.asc - 3 arcsec (90 m) SRTM DEM;
Grid definition:
ncols: 150
nrows: 100
xllcorner: 7394249
yllcorner: 4841999
cellsize: 30 m
proj4:+proj=tmerc +lat_0=0 +lon_0=21 +k=0.9999 +x_0=7500000 +y_0=0 +ellps=bessel +towgs84=574.027,170.175,401.545,4.88786,-0.66524,-13.24673,0.99999311067 +units=m
Lineage:
The original topo-map DEM was produced by digitizing contour layers from two adjacent sheets of the 1:5000 topographic maps with contour interval of 5 m. Two sheets were scanned by ANATech Evolution scanner with 400 DPI resolution, then georeferenced to the Gauss-Krüger coordinate system (7th zone) and converted to a point map using a semi-automated digitalization of contour lines (I/GEOVEC, Intergraph program module). The faults obtained during automated digitalization were removed by 3D editing of contour lines. The final DEM was produced using the ArcGIS 3D analyst: first a TIN was produced, which was then converted to a regular grid of 30~m resolution. This will be referred to as the topo-DEM in further text. The original points extracted from the topo-map (51,847 points) were sub-sampled (for computational efficiency) to 2051 points.
A set of 1020 photogrammetric control points was provided with the help of the Geodetic governmental authority of Serbia. These were obtained throughout the orthophoto map production of the scale 1:1000 for local municipality. Aerial images were obtained using the RMK 21/23 analog camera with calibrated focal length f=207.96 mm. The average flying altitude was 1040 m. A stereoscopic model was produced using the WILD A10 analog stereo-restitution instrument and MapSoft2000 program package. The land-surface points were measured manually from the stereoscopic model with average lag of 15 m. This gave a total number of 46,021 points that were sub-sampled to 1020 points for faster processing. The estimated height accuracy of control points is 15 cm which allows us to use it as ground truth for the topo-DEM.
Data owner: Geodetic governmental authority of Serbia
Reference: Geostatistical modelling of topography using auxiliary maps
Location: Zlatibor, Serbia
43° 43’ 0.0012” N,19° 41’ 60” E
See map: Google Maps
Attachment:
The case study “fishcamp” is of size 1x2 km; located at 37.46353 N; 119.6119 W. The coordinate system used is the UTM NAD83 zone 11 North i.e. EPSG:26911. The complete dataset was obtained from the USGS National Map seamless server.
Fishcamp data layers.
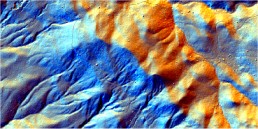 2.5 m LiDAR DEM
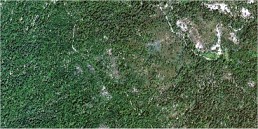 1 m color orthoimage
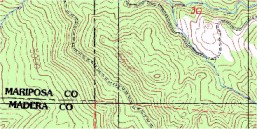 Topo-map 1:25k (contour lines)
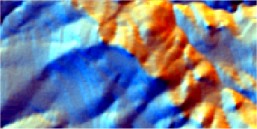 10 and 25 m DEMs
Available layers:
- DEM2m.asc - 2.5 m DEM derived from the LiDAR survey (ground reflectance);
- DEMNED03.asc - 10 m National Elevation Dataset;
- DEMSRTM1.asc - 1 arcsec SRTM DEM (finilized);
- lidar.shp - subsampled LiDAR point measurements (the original dataset consist of over 5 milion of points);
- orthoimg.lan - National Agriculture Imagery Program (NAIP) Orthoimagery for Zone 11;
- topo24k.lan - 1:24k topo-map “White Chief Mountain, CA (37119-D5-TF-024);
- contours.shp - contours digitized from the topo24k map; - tstreams.shp - contour lines digitized from the topo map;
- soilmu.asc - 5 m gridded soil map for the area (1=”HOLLAND FAMILY, 35 TO 65 PERCENT SLOPES”, 2=”CHAIX-CHAWANAKEE FAMILIES-ROCK OUTCROP COMPLEX”, 3=”CHAIX FAMILY, DEEP, 5 TO 25 PERCENT SLOPES”, 4=”CHAIX FAMILY, DEEP, 15 TO 45 PERCENT SLOPES”, 5=”HOLLAND FAMILY, 5 TO 65 PERCENT SLOPES (VALLEYS)”, 6=”CHAIX-CHAWANAKEE FAMILIES-ROCK OUTCROP COMPLEX (HILLTOPS)”)
Grid definition:
ncols: 400
nrows: 200
xllcorner: 267999
yllcorner: 4148999
cellsize: 5 m
proj4:+init=epsg:26911 +proj=utm +zone=11 +ellps=GRS80 +datum=NAD83 +units=m +no_defs +towgs84=0,0,0
Lineage:
The data set was obtained from the USGS National Map seamless server (http://seamless.usgs.gov). The map of soil mapping units was obtained from the Natural Resources Conservation Service (NRCS) Soil Data Mart (http://soildatamart.nrcs.usda.gov). The scripts used to predict soil mapping units and extract landforms are available via the authors website. The elevations range from 1400 to 1800 meters. There are six soil mapping units: (1) Holland family, 35 to 65% slopes; (2) Chaix-chawanakee family-rock outcrop complex; (3) Chaix family, deep, 5 to 25% slopes; (4) Chaix family, deep, 15 to 45% slopes, (5) Holland family, 5 to 65% slopes, valleys; (6) Chaix-chawanakee families-rock outcrop complex, hilltops.
Data owner: USGS
Reference: A Practical Guide to Geostatistical Mapping of Environmental Variables
Location:Fishcamp, United States
37° 27’ 48.708” N,119° 36’ 42.84” W
See map: Google Maps
Attachment:
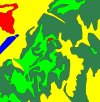
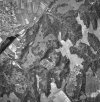
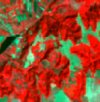
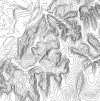
The Baranja Hill study area, located in eastern Croatia, has been mapped extensively over the years and several GIS layers are available at various scales. Its main geomorphic features include hill summits and shoulders, eroded slopes of small valleys, valley bottoms, a large abandoned river channel, and river terraces. All raster images are prepared in the ArcInfo ASCI grid format. The vector maps are prepared as shape files. In addition to the GIS layers, you might also need to use the field observations. Courtesy of the Croatian State Geodetic Department.
Fig: preview of the main GIS layers
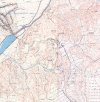 Topomap 1:5K
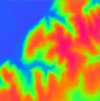 25m DEM
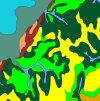 Geoforms
 Landcover
 Orthophoto
 Landsat
 Contours
 25m SRTM
This data set has been used extensively in the Geomorphometry book:
Hengl, T., Reuter, H.I. (eds) 2008.Geomorphometry: Concepts, Software, Applications. Developments in Soil Science, vol. 33, Elsevier, 772 pp. ISBN: 978-0-12-374345-9
Available layers:
- DEM25m - 25 m resolution DEM derived from the 1:5K contours (ArcInfo ASCI grid format);
- contours.shp - Contour lines digitized from the 1:50K topo maps (ESRI Shapefile);
- contours5K.shp - Contour lines digitized from the 1:5K topo maps (ESRI Shapefile);
- wstreams.shp - Streams and water bodies digitized from the 1:50K topo maps (ESRI Shapefile);
- elevations.shp - very precise elevation measurements from 1:5K land survey (ESRI Shapefile);
- DEM25srtm.asc - 25 m resolution DEM from SRTM 2000 project ordered via http://eoweb.dlr.de (ArcInfo ASCI grid format);
- orthophoto.tif - 5 m resolution ortophoto (ArcInfo ASCI grid format);
- topo5K.tif - Topo map 1:5000 (geotif, 23 MB);
- satimage.lan - 25 m resolution Landsat 7 image from September 1999 (ERDAS .lan format);
- landcover.shp - Land cover map digitized from the ortophoto (ESRI Shapefile);
- geoform.shp - Map of the geoforms using the geopedological approach (ESRI Shapefile);Grid definition:
ncols: 147
nrows: 149
xllcorner: 6551884
yllcorner: 5070562
cellsize: 25 mproj4:+proj=tmerc +lat_0=0 +lon_0=18 +k=0.9999 +x_0=6500000 +y_0=0 +ellps=bessel +towgs84=550.499,164.116,475.142,5.80967,2.07902,-11.62386,0.99999445824 +units=mLineage:
50K and 5K scale topomaps and aerial photo have been obtained from the Croatian State Geodetic Department (http://www.dgu.hr). Orthorectified photo was produced following the methodology explained in Rossiter & Hengl (2002). From the orthophoto we digitized on-screen land cover polygon map using the following classes: agricultural fields, fish ponds, natural forest, pasture and grassland, and urban areas. From the stereo-pairs we interpreted the generic landforms and then created a polygon map of geoforms (see also Rossiter & Hengl (2002)). Nine landform elements were recognised: summit, hill shoulder, escarpment, colluvium, hillslope, valley bottom, glacis (sloping), high terrace (tread) and low terrace (tread). From topomaps, we extracted contours and streams and water bodies. In the case of 1:50K the equidistance was 20 m in hilland and 5 m in plain, and for the 1:5K the equidistance was 5 m in hilland and 1 m in plain. From the 1:5K contours and geodetic points, the 5 m DEM has been derived using the ANUDEM (topogrid) procedure in ArcInfo and then resampled to the 25 m gird. The 30 m SRTM DEM (15’x15’ block) was ordered from the German Aerospace Agency (http://eoweb.dlr.de), then resampled to the 25 grid so it can be compared with the DEM25m. IMPORTANT NOTE: According to a licence agreement, the SRTM dataset can not be distributed or used for commercial purposes outside this project.
Data owner: Croatian State Geodetic Department
Reference: Technical note: Creating geometrically-correct photo-interpretations, photomosaics, and base maps for a project GIS (PDF)
Location: Baranja hill, Popovac, Croatia
45° 48’ 16.4412” N, 18° 39’ 54.198” E
See map: Google Maps
Attachment:

On behalf of the organisers we would like to extend a warm welcome to all participants of Geomorphometry 2009 in Zurich. The Geomorphometry 2009 conference continues a series initiated by the Terrain Analysis and Digital Terrain Modelling conference hosted by Nanjing Normal University in November 2006.
Geomorphometry 2009 brings together researchers to present and discuss developments in the field of quantitative modelling and analysis of elevation data. Geomorphometry is the science of quantitative land-surface analysis and description at diverse spatial scales. It draws upon mathematical, statistical and image-processing techniques and interfaces with many disciplines including hydrology, geology, computational geometry, geomorphology, remote sensing, geographic information science and geography.
For the conference, a total of 53 extended abstracts, with authors from 21 countries were submitted for review by the programme committee. Of these, a total of 37 were accepted for presentation at the conference. We believe that the conference programme offers a rich and varied insight into the key themes in geomorphometry today, with a mix of leading researchers in the field presenting methodological advances and young researchers presenting high quality reviewed work to an international audience.
The conference also hosts three keynote speakers. We are delighted that Professor David Mark, SUNY Distinguished Professor in the Department of Geography at the State University of New York at Buffalo and Dr Jo Wood, Reader in GIScience at the Department for Information Science at City University, London will both give presentations on how they have seen development progressing in Geomorphometry during their extensive experience of the field. Furthermore, Stephan Landtwing of BSF Swissphoto, a key producer of LIDAR and other remotely sensed data in Switzerland, will give an industrial keynote – an excellent opportunity for the conference attendees to interface with data producers and better understand issues related to key data sources in geomorphometry.
The conference also hosted two workshops with very different themes, entitled Automated analysis of elevation data in R+ILWIS/SAGA and Back to reality – Reconciling geomorphometry and geomorphology in the field respectively, providing attendees with the opportunity to get their hands dirty figuratively at the computer screen, and literally in the field!
Finally, we would like to thank all of those who make events such as this a success. Our programme committee, who on time and carefully reviewed a large number of papers, our keynote speakers, the workshop organisers, and all those who helped in the local organisation, especially Dagmar Brandova who dealt with registration, as well as the University of Zurich for providing the conference facilities. Finally, and most importantly, we would like to thank the conference participants – without your work and participation there would be no conference. We hope your stay in Zurich will be an enjoyable and stimulating one.
Ross Purves, Stephan Gruber, Tomislav Hengl and Ralph Straumann August 15th, 2009
Attachment: foreword
Latest Posts
Whitebox Workflows Next Gen, a complete rewrite of the Whitebox geospatial analysis platform, is now publicly available for Python, R, and QGIS.
Built from the ground up in pure Rust, Whitebox Next Gen provides more than 700 geospatial analysis tools for geomorphometry, terrain analysis, spatial hydrology, LiDAR processing, remote sensing, vector GIS, and spatial statistics. All three interfaces run on the same high-performance backend, allowing users to work in scripts, notebooks, statistical workflows, or a familiar desktop GIS environment.
Whitebox Next Gen is not an incremental update to the previous Whitebox architecture. It replaces the earlier monolithic system with a modular, full-stack geospatial platform. Core capabilities for raster and vector I/O, coordinate systems and reprojection, vector topology, spatial indexing, LiDAR processing, and other foundational operations are implemented directly within the Whitebox codebase rather than delegated to external C or C++ GIS libraries. This approach provides consistent cross-platform behaviour, fewer system-level dependencies, tighter control over performance and correctness, and greater flexibility for continued research and development
Highlights
Whitebox has particular strengths in terrain analysis, geomorphometry, spatial hydrology, and LiDAR processing. Whitebox Next Gen carries these areas forward while substantially expanding the project’s capabilities for vector analysis, remote sensing, modern spatial data formats, and reproducible geospatial workflows.
Get started
The geomorphometry community is invited to explore Whitebox Next Gen, test its tools and workflows, report issues, and contribute to the continued development of the project.
First round of the DEMIX exercise published final report
Global digital elevation models (DEMs) have become routine operational inputs across mapping, environmental monitoring, modelling and Earth-observation workflows. Their broad coverage and global availability have made them data that many practitioners simply take for granted. But knowledge of the terrain and topography of Earth’s surface is fundamental for monitoring and understanding terrestrial ecosystems and the planet’s habitability. For that reason, the CEOS Working Group on Calibration and Validation (WGCV) maintains a subgroup dedicated to digital topography and the quality of DEMs, the ‘Terrain Mapping Sub-Group (TMSG).
DEMs are representations of elevation in the form of a georectified grid, at global scale commonly derived from space-based interferometric synthetic aperture radar (InSAR) or stereoscopic optical observations, while regionally and locally airborne Laser induced detection and ranging (LIDAR) has become the primary source. DEMs can be classified as digital surface models (DSMs) when depicting the lower surface of the atmosphere or digital terrain models (DTMs) when depicting the top of the lithosphere (the Earth’s crust).
A wide variety of DEM products exist – each having different characteristics which suit different applications. It can be challenging to understand which of the available DEM products are fit for purpose for certain applications or regions. That is the practical gap addressed by the Digital Elevation Model Intercomparison Exercise (DEMIX) undertaken by TMSG. By exposing where widely used global DEMs agree, where they differ and how those differences affect rankings, the exercise delivered evidence to users for selecting a DEM rather than defaulting to one by habit.
DEM products were compared through a ‘wine contest,’ which identified requirements of openness, reproducibility, adaptability, and statistical rigour. The characteristics, evaluations, and ranking for each DEM were collected in a GIS database with over 50,000 entries. A quantitative assessment was carried out for each global DEM based on pixel-by-pixel differences of geomorphometric parameters against finer spatial resolution (1-5 m resolution) reference DEMs.
The study incorporates an unprecedented amount of high quality reference data covering a broad range of landforms and surface types, comparing their characteristics without resampling or interpolation. Users are invited to consult the results of DEMIX in order to make informed choices when needing to use a DEM, or in some cases a combination of the most relevant DEMs for their applications.
The final rankings of the wine contest, presented below, compared the six DEMs based on land cover (forest, urban, or barren), slope (cliff, steep, gentle, or flat), differences in elevation, slope and roughness, and statistical metrics.
Led by the European Commission’s Joint Research Centre (JRC), the CEOS Working Group on Calibration and Validation (WGCV) Terrain Mapping Subgroup (TMSG) established DEMIX in partnership with the International Society for Geomorphometry. Several members of the International Society of the Geomorphometry contributed significantly and we hosted various secssions at our latest conference. The exercise was performed over a three-year period starting in 2020, with community-wide calls for participation and an assembly of experts producing a number of peer-reviewed publications, culminating with a JRC reference report published in July 2026.
The objective of DEMIX was to propose a procedure to rank the available free and open global DEMs, taking into consideration user needs while promoting the implementation of FAIR (Findable, Accessible, Interoperable and Reusable) principles. The exercise compared DEMs based on criteria for land cover and terrain slope categories, representative testing, and a statistically sound ranking approach. The report outputs tailored recommendations regarding available DEM products that are not limited to one domain, geographic area, or landscape type, with flexibility for different user needs and applications.
A major challenge in the comparison of the global DEMs were the varying formats, data, and metadata contents. The adoption of a common set of standards would enhance the quality and interoperability of global DEMs and streamline the exchange and utilisation of DEM data for both providers and users. DEMIX makes the following recommendations for data providers:
● Adopt a standardised grid layout, with complete grid definitions and encodings following ISO/OGC rules.
● Include vertical datum information as part of raster DEM files.
● Clearly indicate the product version in the file names.
● Participate in future DEMIX rounds, which serve as a neutral platform for independently evaluating products before their release.
● Provide high quality, finer resolution, accurate, and multi-temporal elevation data to be used as a reference alongside DEM products.
Global DEMs are indispensable operational geospatial datasets, but they should not be treated as error-free or interchangeable. DEMIX delivered to the global community a systematic and transparent method to help choose elevation products more intelligently and help define what better elevation measurements should look like in the future.
Read more in the DEMIX Final Report, or see other DEMIX publications below - mainly by our ISG members:
Building the world’s largest repository of FAIR drone mapping data
Paul Mead
GeoNadir

September 2nd, 2026
11:30 (UTC)
Bio: Paul Mead is Co-founder and Head of Business & Strategy at GeoNadir, a platform building the world’s largest repository of FAIR drone mapping data to support environmental decision-making. A non-technical co-founder, Paul focuses on strategy, commercial development, and building high-performing teams — a discipline shaped by 11 years in the New Zealand Army, including leading a bomb disposal team in Lebanon and service in Afghanistan and the Asia-Pacific region. Since 2013 he has built and led several small businesses and start-ups, with drones as a central technology since 2016. Alongside GeoNadir, Paul co-founded She Maps, an internationally recognised drone and geospatial STEM education organisation, and has helped raise over $7M in equity and non-equity funding across his ventures. He holds a Master of Philosophy from the University of Queensland and is a Chartered Manager.
Abstract: GeoNadir set out to build the world’s largest repository of FAIR drone mapping data, and ended up building something more powerful. Drones have democratised data capture, but the same democratised ability to generate decision-grade insights from the data is lacking. I’ll walk through how we’re closing that gap: the data infrastructure behind hosting large volumes of UAV imagery and derived products, and how we’re moving from manual analysis toward automated, repeatable geospatial analytics.