Blog

Continental Europe Digital Terrain Model at 30 m resolution based on multisource data

Within the OpenDataScience.eu (Geo-harmonizer) project we have recently produced an Digital Terrain Model for Continental Europe based on the four publicly available Digital Surface Models: MERITDEM, AW3D30, GLO-30, EU DEM. This is basically an Ensemble Machine Learning approach where GEDI level 2B points (Level 2A; “elev_lowestmode”) and ICESat-2 (ATL08; “h_te_mean”) were used to train a multisource model to predict “most probable height of terrain” including the prediction errors per pixel.

So which of the four big global DEM’s is the best match with terrain heights? Our results indicate that it is the MERITv1.0.1 (originally available at 90-m, but was downscaled here to 30-m using cubic splines) followed by the AW3Dv2012 and GLO-30. This confirms that Yamazaki et al. (2017) have done an excellent work in filtering out canopy and artifacts in the original SRTM/AWD30 data.

Read more about MERIT DEM in:

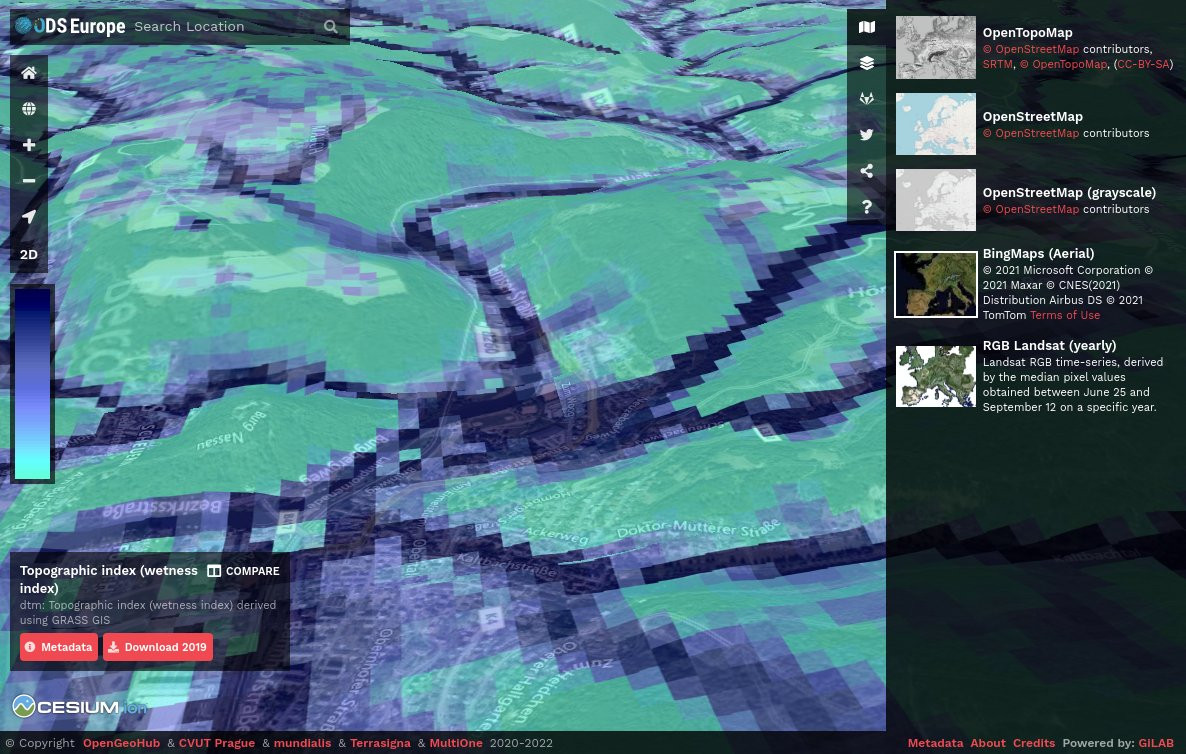
To access the Continental Europe Digital Terrain Model at 30-m please visit https://maps.opendatascience.eu and select “terrain” from the layer menu.

You can also download the DTM for EU including the regression matrix with all training points (GEDI/ICESat) via:

Your opinion on object-based classification of topography - Evaluation still possible!

WEB APPLICATION and QUESTIONNAIRE at http://zgis205.plus.sbg.ac.at/PhysiographicClassificationApplication/default.aspx

Dear colleagues, We kindly ask for your help in evaluating the preliminary outputs of a global physiographic classification. The methodology has been designed for general purposes. We hope, however, that the results can be tuned to specific applications, by using the object attributes, without a need of running the classification again. Potential domains of application include Landscape Ecology, Ecology, Geomorphology, Geology, Hydrology, Soil Science, and Agriculture. Your evaluation would be useful in improving the current classification. The results of your evaluation will be part of a paper we intend to submit to a peer-reviewed journal. Classification results are embedded within a web application available at the following address

http://zgis205.plus.sbg.ac.at/PhysiographicClassificationApplication/default.aspx.

You can visualize the results and let us know your opinion by filling in the form under the red button named ‘Please provide your feedback here.’ Apart of the classification itself, i.e. to which degree classes describe correctly given regions, we would like you evaluating the quality of object boundaries, i.e. to which degree boundaries match topographic discontinuities. After evaluation, both the database and the tool will be released for free download.

Please find below additional details on the methods and the web application.

GDEM - a quick assessment

The first 30 m resolution global ASTER-based DEM (GDEM) has recently been released. This is now the most detailed global GIS layer with public access (read more). The GDEM was created by stereo-correlating the 1.3 million-scene ASTER archive of optical images, covering almost 98% of Earth’s land surface (claimed 95% vertical accuracy: 20 meters, 95% horizontal accuracy: 30 meters). The one-by-one-degree tiles can be downloaded from NASA’s EOS data archive and/or Japan’s Ground Data System. The download of DEMs for large areas is at the moment difficult and limited to 100 tiles.

I have downloaded some GDEM tiles for the areas in the Netherlands, Italy, Serbia and USA, and compared these with the most accurate LIDAR-derived DEMs (aggregated to 25 m resolution) available for the same area. The data used for comparison and shown in plot below can be obtained from here. I was interested to see how accurate is the GDEM and what are the main limitations of using it for various mapping applications.

Conceptually speaking, accuracy of topography (or better to say relief) can be represented by examining (at least) the following three aspects of a DEM:

  • Accuracy of absolute elevations (simply the difference between the GDEM and true elevation);
  • Accuracy of hydrological features (deviance of stream networks, watershed polygons etc. from true lines);
  • Accuracy of surface roughness (deviance of the nugget variation and/or difference in local relief quantified using e.g. difference from the mean value);

Fig: Comparison of the GDEM and LiDAR-based DEMs for four study areas: (1) fishcamp; (2) zlatibor; (3) calabria, and (4) boschord (all maps prepared in resolution 25-30 m).

The results of this small comparison show that:

  1. The average RMSE for elevations for these for data sets is: 18.7 m;
  2. The average error of locating streams is between 60-100 m;
  3. Surface roughness is typically under-represented so that the effective resolution of GDEM is possibly 2-3 times coarser than the actual;

In addition, by visually comparing DEMs for the four case studies, you will notice that GDEM often carries some artificial lines and ghost-like features (GDEM tiles borders, vegetation cover etc.). The worst match between the GDEM and LiDAR-based DEM (reality) is in areas of low relief (boschord). Practically, GDEM looks to be of absolutely no use in areas where the average difference in elevations is <20 m. As the producers of GDEM themselves indicated: “The ASTER GDEM contains anomalies and artifacts that will reduce its usability for certain applications, because they can introduce large elevation errors on local scales”.

In summary, I can only conclude that (a) there is still a lot of filtering to be done with GDEM to remove the artificial breaks and ghost lines; (b) the effective resolution of the GDEM is probably 60-90 m and not 30 m, hence the whole layer should be aggregated to a more realistic resolution; (c) the first impression is that GDEM is not more accurate than the 90 m SRTM DEM, especially if one looks at the surface roughness and land surface objects. On the other hand, the horizontal accuracy of GDEM is more than satisfactory and GDEM has a near to complete global coverage, so that it can be used to fill the gaps and improve the global SRTM DEM. In addition, the GDEM comes also with a quality assessment (QA) map. Each QA file pixel contains either: (1) the number of scene-based DEMs contributing to the final GDEM value for each 30 m pixel (stack number); or (2) the source data set used to replace identified bad values in the ASTER GDEM.

Important info Geomorphometry 2009

Dear Geomorphometry Participants,

Geomorphometry 2009 is getting closer, and this post contains important information with respect to the conference. All of this information, together with maps and a programme is also in the attached PDF, so as to provide a printable set of information.

Arrival and Travel in Zurich

Most of you will either arrive by train or plane. If you are staying near the University, then the easiest way to travel from the airport is to take a Tram (10) from outside the airport building. Follow the signs through the terminal and the airport shopping centre to find the tram stop. For all other locations, it is simplest to take a train to Zurich HB (the main station). In both cases you need a 1-way ticket to the city, which you can buy from machines or people at the airport railway station and tram stop. Always travel with a ticket – inspections are frequent, and not speaking German won’t save you from an expensive fine. In town, the cheapest way to get around is with a Tageskarte – a 24 hour ticket valid from the time of purchase for the whole city for the next 24 hours. These cost 8.00 SFr and can be used on trains, buses, trams and even boats inside Zone 10. Note that the airport is not in Zone 10! You can find a Zurich travel network plan. Trams are every 10 minutes or so. Weather The weather in Zurich is changeable. So, plan for it hopefully being warm and sunny, but possibly also being rainy and cold! Our conference dinner venue will involve some walking, whatever the weather.

Conference Registration

Registration will be open on Monday, 31st August from 8.30. The attached map shows the route from the Irchel and Milchbuck tram stops to the registration desk, which is adjacent to the lecture theatre where the single conference track will take place.

Conference Events and Facilities

There will be a Welcome Apéro on Monday evening (drinks and snacks) and the conference dinner will be on Tuesday evening. The conference dinner will be traditional Swiss food, with a vegetarian option, in a restaurant in the nearby hills. Travel there will be by public transport, and we will travel there together. During the conference there will be two coffee breaks per day and lunch will be in the University Mensa, using tickets that you will receive on registration. There will be wireless access to the Internet in the University buildings, through accounts which we will provide on arrival.

Workshops

If you have signed up for a workshop, you will receive detailed information about your workshop separately in August.

Conference Programme

A provisional conference programme is available here. We are delighted to have 3 keynote speakers, as well as an exciting programme of conference talks. Information for Presenters All talks have a slot of 25 minutes, including questions and changeover. Thus, we plan to use a single machine for all talks. This machine will have Internet access, Powerpoint 2003, and Adobe Acrobat installed. If you have other, special requirements, please let us know in advance. We will gather talks before each session at the registration desk for installation and testing. If you have any questions about the conference then please don’t hesitate to contact us.

We look forward to meeting you in Zurich.

Best wishes,

Ross Purves, Stephan Gruber and Ralph Straumann Local organisers

map of events

Geomorphometry_final_ann

Geomorphometry 2021 - Conference Registration

Website registration

Registration to the website (getting your website account) is needed to register to the Conference.

Upon registering online you must choose a Username and a Password and provide few personal information. This initial registration will enable you to surf the site, keep track of the status of your registration, register to the conference, pay the registration fees, just to name a few.

Go to LOGIN form

Conference Registration

The registration to the the Conference is subject to the payment of the following fees

In Presence

  • Full registration: € 150
  • Full on-site registration: € 200
  • 1-Day registration: € 100

Online

  • Full registration: € 50 (Please read below about credit card payments with Mastercard)

The registration fees entitles you to:

  • Admittance to Geomorphometry 2021 Events including the Technical Workshops
  • Access to the electronic proceedings

No other serviceis included

Payment

To pay for the Registration Fees you may use the following methods of payment:

1) Bank Transfer; If you wish to pay by bank transfer, before making it out, please go to the Geomorphometry eShop and go through the purchase process selecting the Bank Transfer payment method. At the end of the process you will be assigned an Order ID that must be returned in the “Reason for payment” of your transfer so that the payment verification operations are faster and accurate.

Account owner: T4E Srl

Owner address: Via Dalmazio Birago 18 06124 Perugia Italy

IBAN International Bank Account Number: IT88V0707503007000000615175

BIC swift Bank Identification Code: ICRAITRRTV0

Bank name: Banca Centro - Credito Cooperativo Toscana - Umbria

Bank address: Via Martiri dei Lager 06128 Perugia Italy

2) Credit Card; Only VISA and Mastercard (please note that, as of September 10, Mastercard is experiencing problems in the last few days and if you have 3D SecureTM control enabled you won’t be able to use your card) circuits are accepted and we would like to inform you that your paymnet may require the credit card 3D Secure™ (or 3DS) authentication code.

More over, please make sure to allow pop-ups and redirects from https://payway.sinergia.bcc.it which is the address of the secure server of our bank

The 3D Secure™ is a secure online payment service. The authentication procedure is simple and involves 3 steps.

  • Place your order and enter your debit or credit card information.
  • If the security system is activated for your card, a 3D Secure™ window will open. Your bank or CC circuit will ask you to verify your identity by entering an authentication code. In most cases, this is a single-use security code that is sent to you by SMS on your mobile phone.
  • Once you enter the correct security code your payment is accepted. The 3D Secure™ payment system is available through your bank under the name “Verified by Visa” for Visa cards or “Mastercard SecureCode” for Mastercard cards.

3) Cash (on-site only). On-site cash payments can be made out only in Euro.

Latest Posts

Whitebox Workflows Next Gen released

Whitebox Workflows Next Gen, a complete rewrite of the Whitebox geospatial analysis platform, is now publicly available for Python, R, and QGIS.

Built from the ground up in pure Rust, Whitebox Next Gen provides more than 700 geospatial analysis tools for geomorphometry, terrain analysis, spatial hydrology, LiDAR processing, remote sensing, vector GIS, and spatial statistics. All three interfaces run on the same high-performance backend, allowing users to work in scripts, notebooks, statistical workflows, or a familiar desktop GIS environment.

Whitebox Next Gen is not an incremental update to the previous Whitebox architecture. It replaces the earlier monolithic system with a modular, full-stack geospatial platform. Core capabilities for raster and vector I/O, coordinate systems and reprojection, vector topology, spatial indexing, LiDAR processing, and other foundational operations are implemented directly within the Whitebox codebase rather than delegated to external C or C++ GIS libraries. This approach provides consistent cross-platform behaviour, fewer system-level dependencies, tighter control over performance and correctness, and greater flexibility for continued research and development

Highlights

  • More than 700 tools for geomorphometry, hydrology, LiDAR, remote sensing, vector analysis, spatial statistics, and general geospatial processing
  • Publicly available interfaces for Python, R, and QGIS
  • A modular, high-performance backend written entirely in Rust, including wbprojection, wbraster, wbvector, wblidar, wbspatialstats, and wbtopology open-source (MIT/Apache licensed) backend libraries
  • Most of the 80+ tools that existed within the previous extension product have been migrated to the new Whitebox open core, including the tools for advanced surface curvature analysis and DEM processing
  • Native coordinate-reference-system handling and reprojection workflows via wbprojection
  • Expanded raster support (19 formats), including GeoTIFF, Cloud-Optimized GeoTIFF (COGs), GeoPackage Raster, and JPEG2000
  • Expanded vector support (12 formats), including Shapefile, GeoPackage, FlatGeobuf, GeoParquet, GeoJSON, TopoJSON, and GML
  • Modern point-cloud support, including LAS, LAZ, COPC, E57, and PLY
  • A dedicated topology engine supporting robust vector analysis, network analysis, route-event workflows, and linear referencing
  • Local-first processing on Windows, macOS, and Linux
  • A consistent analysis platform across Python scripts and R workflows
  • A newly updated and more advanced QGIS Processing toolbox

Whitebox has particular strengths in terrain analysis, geomorphometry, spatial hydrology, and LiDAR processing. Whitebox Next Gen carries these areas forward while substantially expanding the project’s capabilities for vector analysis, remote sensing, modern spatial data formats, and reproducible geospatial workflows.

Get started

The geomorphometry community is invited to explore Whitebox Next Gen, test its tools and workflows, report issues, and contribute to the continued development of the project.

DEMIX reveals which DEMs perform best

First round of the DEMIX exercise published final report

Global digital elevation models (DEMs) have become routine operational inputs across mapping, environmental monitoring, modelling and Earth-observation workflows. Their broad coverage and global availability have made them data that many practitioners simply take for granted. But knowledge of the terrain and topography of Earth’s surface is fundamental for monitoring and understanding terrestrial ecosystems and the planet’s habitability. For that reason, the CEOS Working Group on Calibration and Validation (WGCV) maintains a subgroup dedicated to digital topography and the quality of DEMs, the ‘Terrain Mapping Sub-Group (TMSG).

DEMs are representations of elevation in the form of a georectified grid, at global scale commonly derived from space-based interferometric synthetic aperture radar (InSAR) or stereoscopic optical observations, while regionally and locally airborne Laser induced detection and ranging (LIDAR) has become the primary source. DEMs can be classified as digital surface models (DSMs) when depicting the lower surface of the atmosphere or digital terrain models (DTMs) when depicting the top of the lithosphere (the Earth’s crust).

A wide variety of DEM products exist – each having different characteristics which suit different applications. It can be challenging to understand which of the available DEM products are fit for purpose for certain applications or regions. That is the practical gap addressed by the Digital Elevation Model Intercomparison Exercise (DEMIX) undertaken by TMSG. By exposing where widely used global DEMs agree, where they differ and how those differences affect rankings, the exercise delivered evidence to users for selecting a DEM rather than defaulting to one by habit.

DEM products were compared through a ‘wine contest,’ which identified requirements of openness, reproducibility, adaptability, and statistical rigour. The characteristics, evaluations, and ranking for each DEM were collected in a GIS database with over 50,000 entries. A quantitative assessment was carried out for each global DEM based on pixel-by-pixel differences of geomorphometric parameters against finer spatial resolution (1-5 m resolution) reference DEMs.

The study incorporates an unprecedented amount of high quality reference data covering a broad range of landforms and surface types, comparing their characteristics without resampling or interpolation. Users are invited to consult the results of DEMIX in order to make informed choices when needing to use a DEM, or in some cases a combination of the most relevant DEMs for their applications.

The final rankings of the wine contest, presented below, compared the six DEMs based on land cover (forest, urban, or barren), slope (cliff, steep, gentle, or flat), differences in elevation, slope and roughness, and statistical metrics.

Led by the European Commission’s Joint Research Centre (JRC), the CEOS Working Group on Calibration and Validation (WGCV) Terrain Mapping Subgroup (TMSG) established DEMIX in partnership with the International Society for Geomorphometry. Several members of the International Society of the Geomorphometry contributed significantly and we hosted various secssions at our latest conference. The exercise was performed over a three-year period starting in 2020, with community-wide calls for participation and an assembly of experts producing a number of peer-reviewed publications, culminating with a JRC reference report published in July 2026.

The objective of DEMIX was to propose a procedure to rank the available free and open global DEMs, taking into consideration user needs while promoting the implementation of FAIR (Findable, Accessible, Interoperable and Reusable) principles. The exercise compared DEMs based on criteria for land cover and terrain slope categories, representative testing, and a statistically sound ranking approach. The report outputs tailored recommendations regarding available DEM products that are not limited to one domain, geographic area, or landscape type, with flexibility for different user needs and applications.

A major challenge in the comparison of the global DEMs were the varying formats, data, and metadata contents. The adoption of a common set of standards would enhance the quality and interoperability of global DEMs and streamline the exchange and utilisation of DEM data for both providers and users. DEMIX makes the following recommendations for data providers:

● Adopt a standardised grid layout, with complete grid definitions and encodings following ISO/OGC rules.

● Include vertical datum information as part of raster DEM files.

● Clearly indicate the product version in the file names.

● Participate in future DEMIX rounds, which serve as a neutral platform for independently evaluating products before their release.

● Provide high quality, finer resolution, accurate, and multi-temporal elevation data to be used as a reference alongside DEM products.

Global DEMs are indispensable operational geospatial datasets, but they should not be treated as error-free or interchangeable. DEMIX delivered to the global community a systematic and transparent method to help choose elevation products more intelligently and help define what better elevation measurements should look like in the future.

Further Reading:

Read more in the DEMIX Final Report, or see other DEMIX publications below - mainly by our ISG members:

  • Benchmarking Elevation Plus Land Surface Parameters Finds FathomDEM and Copernicus DEM Win as Best Global DEMs (2025) and subsequent discussion (2026a, 2026b)
  • Ranking of 10 Global One-Arc-Second DEMs Reveals Limitations in Terrain Morphology Representation 2025
  • Novel Approach for Ranking DEMs: Copernicus DEM Improves One Arc Second Open Global Topography (2024)
  • Digital Elevation Models: Terminology and Definitions (2021)
  • The Digital Elevation Model Intercomparison eXperiment DEMIX, a community-based approach at global DEM benchmarking (2021)
Coffee Talk - GeoNadir

Building the world’s largest repository of FAIR drone mapping data

Paul Mead GeoNadir

September 2nd, 2026
11:30 (UTC)

Bio: Paul Mead is Co-founder and Head of Business & Strategy at GeoNadir, a platform building the world’s largest repository of FAIR drone mapping data to support environmental decision-making. A non-technical co-founder, Paul focuses on strategy, commercial development, and building high-performing teams — a discipline shaped by 11 years in the New Zealand Army, including leading a bomb disposal team in Lebanon and service in Afghanistan and the Asia-Pacific region. Since 2013 he has built and led several small businesses and start-ups, with drones as a central technology since 2016. Alongside GeoNadir, Paul co-founded She Maps, an internationally recognised drone and geospatial STEM education organisation, and has helped raise over $7M in equity and non-equity funding across his ventures. He holds a Master of Philosophy from the University of Queensland and is a Chartered Manager.

Abstract: GeoNadir set out to build the world’s largest repository of FAIR drone mapping data, and ended up building something more powerful. Drones have democratised data capture, but the same democratised ability to generate decision-grade insights from the data is lacking. I’ll walk through how we’re closing that gap: the data infrastructure behind hosting large volumes of UAV imagery and derived products, and how we’re moving from manual analysis toward automated, repeatable geospatial analytics.